Looking for human resources (HR) statistics to better understand the employment landscape in 2024? We’ve compiled these statistics from reputable sources to help job seekers and hiring managers alike.
If you’re a job seeker, understand what HR professionals are looking for, how prevalent remote work is, and what kinds of benefits and perks employees are negotiating for.
If you’re an HR professional, make the most of our HR statistics to recruit, manage, and engage your teams.
Our HR statistics cover the following areas:
- Job searching (who’s looking for jobs, reasons for job searching, how to find jobs)
- Recruiting (recruiting challenges, how HR vs. job seekers view recruitment)
- Remote working (status of remote work, employee views on remote work)
- Employee engagement (worker satisfaction, mental health, pay, and benefits)
- Quitting (who’s leaving their job, reasons for leaving a job)
25+ job search statistics
From job seeker demographics to hiring statistics in 2024, we provide data below that spans the job search process.
Whether you’re writing a CV, resume, or cover letter — these statistics will help you gain a stronger understanding of where job trends currently stand.
General job search statistics
- The U.S. workforce (people aged 15 to 65) is expected to shrink by 3.2% between 2026 and 2036 (Indeed & Glassdoor, 2023).
- As of December 2023, approximately 5.8 million people want a job (U.S. Bureau of Labor Statistics, 2023).
- According to Forbes, on average 118 people apply for a single job posting. and only 20% of applicants are invited to interview (Forbes, 2023).
- 2.5% of U.S. workers change employers per month, an average of roughly 4 million people (Pew Research Center, 2022).
- A recent survey found that more than half (56%) of the workforce is likely to look for a new job in the next 12 months, with 37% of workers saying they’re “very likely,” up from 32% in 2022 (Bankrate, 2023).
- 1 in 5 workers say they’re somewhat or very likely to look for a new job in the next 6 months (Pew Research Center, 2022).
- 37% of workers believe finding a new job will be somewhat or very difficult (Pew Research Center, 2022).
- Of people who left their job in the first quarter of 2022, 34% were at a new job, 18% were unemployed and looking for work, and 48% were out of the labor force (not looking for work) when surveyed the month following their departure (Pew Research Center, 2022).
- 23% of respondents in a recent employment survey have switched industries since the pandemic began (Employ, 2022).
- Nearly half of career changes involve a change in industry. 48% of U.S. workers who changed jobs from 2019 to 2021 also changed industries in the process (Pew Research Center, 2022).
- 41% of workers plan to have a second income source/side hustle (Employ, 2022).
- 60% of respondents to an Employ survey cited money as the top reason for having a side hustle, compared to 23% of respondents who primarily consider their side hustle a “passion project” (Employ, 2022).
Who is looking for a new job?
- According to the Bureau of Labor Statistics (BLS), in the fourth quarter of 2023, an average of 3.1 million women and 3.1 million men entered the labor force per month (BLS, 2023).
- 29% of workers who report having poor or fair personal finances searched for a new job in 2022, compared to 15% of those who report good or excellent finances (Pew Research Center, 2022).
- Workers without a high school education are the most likely to change jobs, changing at a rate of 3.5% per month — compared to high school graduates at 2.8%, and workers holding a bachelor’s degree at 2.1% (Pew Research Center, 2022).
- 45% of workers with low job security looked for a new job in 2022, compared to 14% of workers with high job security (Pew Research Center, 2022).
- Workers aged 16 to 24 are the most likely to change jobs compared to other age groups (at 4.4% per month). The next group most likely to change jobs was 25 to 34-year-olds, at 2.8%. The group least likely to change jobs is workers over 65, at 1.4% (Pew Research Center, 2022).
- Tech workers are the most likely to be seeking or planning to look for a new job in 2022 (53% of workers), followed by employees in manufacturing (49%), education (48%), and retail (46%) (Employ, 2022).
If you’re looking for a new job, you’ll need to know how to make a good resume. Try studying some resume examples to help you learn what qualifications and skills your target industry is expecting from prospective applicants, so you’ll get a better idea of how to enhance your job application.
Why are people on the hunt for new jobs?
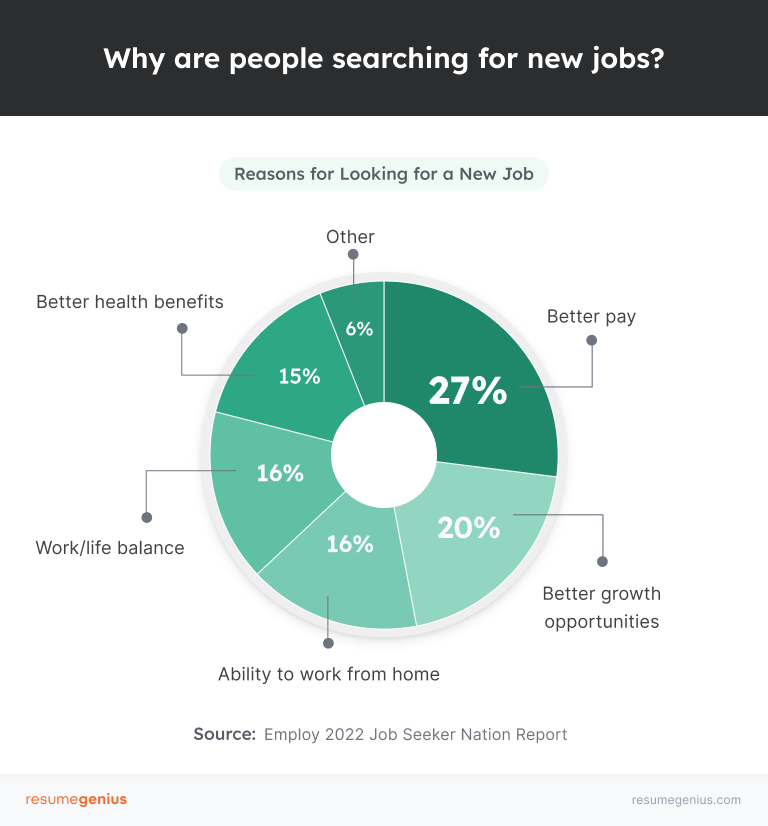
- The top reasons given by job seekers for finding new employment are:
- Compensation (27%)
- Better growth opportunities (20%)
- Pursuing work-from-home opportunities (16%)
- Better work/life balance (16%)
- Health benefits (15%) (Employ, 2022)
- 31% of job seekers aged 25 to 54 cite higher pay as the reason for their job search, compared to 16% who want to change careers (Indeed & Glassdoor, 2023).
- From 2021 to 2022, workers who changed employers saw a 9.7% increase in their pay, while workers who stayed with the same employer saw a 1.7% decrease (Pew Research Center, 2022).
The job search process
- These are the top three pain points job changers report during the job search:
- Low-paying jobs (46% of respondents)
- Failing to secure interviews (42%)
- Non-responsive hiring managers (35%) (Employ, 2022)
- Other job search frustrations include:
- Difficulty finding jobs that fit (31%)
- The stress of the job-seeking process (28%)
- Being judged by algorithms instead of hiring managers (28%)
- Deceptive job descriptions (27%)
- Lack of jobs in their profession (26%) (Employ, 2022)
- 20% of job seekers say that writing and updating job materials is the most frustrating aspect of the job search (Employ, 2022).
- Workers most often find job openings through online job boards (59% of respondents), friends (46%), social media sites like LinkedIn and Facebook (39%), employer career sites (33%), professional connections (25%), and career fairs (23%) (Employ, 2022).
- The most used job boards are Indeed (52% of job seekers), LinkedIn (17%), Facebook (9%), and CareerBuilder (6%) (Employ, 2022).
- Gen Z job seekers are more likely to search for jobs on their phone — 32% of Gen Z job seekers conduct job searches with a mobile device or app, compared to 22% across all age groups (Monster, 2022).
If you’re tired of creating your own application materials, try using a fully customizable resume template or a resume builder with pre-written bulleted points to help you save time and ensure your resume is professionally formatted.
45+ recruiting statistics
The Great Resignation underscored one of the biggest challenges in recruitment: mismatched expectations between employers and workers. These statistics will help you to better understand and manage recruitment in 2024 — no matter which side of the interview table you’re on.
Recruiting challenges
According to Monster.com’s Future of Work Report (2022) and Recruitment Survival Guide (2023):
- 9 out of 10 employers report that they are struggling to fill positions because of a skills gap (Monster, 2022).
- However, 96% of recruiters say they’re confident they’ll find the right candidates for open positions (including 55% who are “very confident”) (Monster, 2023).
- 34% of employers believe that the skills gap between the roles to be filled and the applicant pool increased in 2022 over the previous year (Monster, 2023).
- 34% of recruiters for white-collar jobs struggle to find applicants with matching skills (Monster, 2022).
- Employers report that the top hard skills applicants struggle to match are information technology (IT) skills and strategic planning. The top soft skills gaps are in teamwork and communication (Monster, 2022).
- Recruiters offering flexible/hybrid work are almost 50% more confident they’ll find the right candidates for open positions, compared to those recruiting for onsite work (68% compared to 46%) (Monster, 2023).
- In an increasingly competitive job market, companies plan to recruit qualified candidates by making roles more flexible (37% of companies), increasing benefits and perks (35%), offering skills training (32%), and increasing salary and wages (32%) (Monster, 2022).
According to Employ’s 2023 Recruiter Nation Report:
- The biggest challenges reported by recruiters in 2023 are:
- Not enough candidates to fill open positions (31%)
- Competition from other employers (30%)
- Not able to compete with salary requirements (25%)
- Meanwhile, internal HR decision-makers in 2023 reported that their biggest challenges are:
- Too many candidates for open positions (24%)
- Hiring process that takes too long (24%)
- Not being able to offer remote or hybrid work (22%) (Employ, 2023)
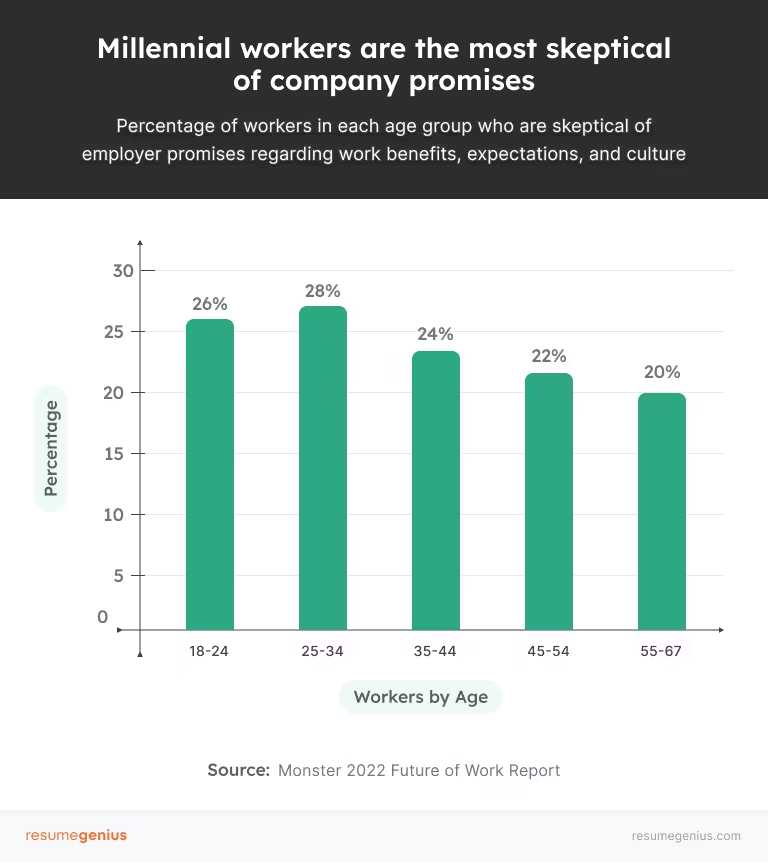
- On average, 24% of workers are skeptical about the promises companies make regarding job expectations, benefits, and culture. Among these respondents:
- 28% are millennials (workers aged 25 to 34)
- 26% are Gen Z (aged 18 to 24)
- 20% are workers aged 55 to 67 (Monster, 2022)
- Employers and candidates don’t match on their top priorities. In order of importance, candidates are most looking for:
- Salary protection/fair compensation
- Bonuses
- Healthcare benefits
- Flexible work schedules
- PTO
- By contrast, employers most frequently advertise these benefits (in order of frequency):
- Healthcare benefits
- PTO
- Flexible work schedules
- Remote work flexibility
- Salary protection/fair compensation (Monster, 2022).
- While 44% of employers are prioritizing remote flexibility, only 24% of job seekers are looking for it (Monster, 2022).
Recruitment from the hiring manager’s perspective
- The top 3 hard skills employers want are IT, strategic planning, and operations skills (Monster, 2022).
- The top 3 soft skills employers want are teamwork, communication, and critical thinking (Monster, 2022).
- The top factors that made applicants stand out are their interview presence, their relevant work or internship experience, and how well their skills matched the role (Monster, 2022).
- Almost half of employers (46%) no longer consider job hopping a red flag (Monster, 2022).
- Living outside the company’s geographic area shifted from a red flag to acceptable for 42% of employers in 2022, compared to 38% of employers who held that opinion in 2021 (Monster, 2022).
- 50% of employers think candidates need to articulate their skills better (Monster, 2022).
- A college degree is not as important as it once was — employers ranked a college degree as the 8th most important factor that makes a candidate stand out in 2022, down from the 7th most important in 2021 (Monster, 2022).
- College grades are becoming less important to employers, with hiring managers ranking GPA/grades as the 12th most important in 2022 (down from 10th in 2021) among factors that make applicants stand out (Monster, 2022).
- 63% of employers are willing to hire and train candidates with transferable skills (Monster, 2022).
- Employers say the most effective resources for finding candidates are:
- Personal connections (34% of employers)
- Job board postings (29%)
- Candidates’ online profiles (28%)
- Networking (27%)
- Posting on a career site or the company’s site (27%)
- Resume database searches (24%) (Monster, 2022)
- 42% of employers believe that flexible work arrangements give them a recruiting advantage and help them retain talent (Monster, 2022).
- The number of U.S. job postings on Indeed offering signing bonuses in July 2022 (5.2%) was more than triple what they were in July 2019 (Indeed & Glassdoor, 2023).
Recruitment from the job seeker’s perspective
- Job seekers want employers to stop taking into account their social media (37% of respondents), resume gaps (35%), and cover letters (31%) (Employ, 2022).
- 33% of job seekers wish employers wouldn’t ghost them (Employ, 2022).
- 19% of respondents said they’ve ghosted an employer during the hiring process (Employ, 2022).
- Workers’ top requested conditions from employers include higher compensation (67% of respondents), flexibility and autonomy (49%), and long-term job security (47%) (Employ, 2022).
- Workers also value:
- Praise, respect, and recognition (39% named these as what they most want)
- 100% remote work (31%)
- Promotions (26%)
- Learning and development opportunities (26%) (Employ, 2022)
- 53% of respondents say compensation is a top consideration in deciding to accept a job offer (Employ, 2022).
- In 2022, applicants reported the top reasons for declining a job offer are compensation (38% of respondents), location (27%), and no flexibility to work remotely (22%) (Employ, 2022).
- Workers in different industries have different top values:
- 56% of tech workers want flexibility and autonomy (9% higher than other industries)
- 55% of manufacturing workers want long-term security (9% higher than other industries)
- 52% of healthcare workers want praise, respect, and recognition (Employ, 2022)
Gender gaps in salary negotiation
- A significant majority of U.S. workers, both men and women, don’t negotiate their starting salaries, with men slightly more likely to negotiate than women (32% vs. 28%) (Pew Research Center, 2023).
- However, 66% of those who do negotiate their pay report success in obtaining a higher salary than initially offered (Procurement Tactics, 2023).
- Women are more likely than men (38% vs. 31%) to say that after asking for higher pay, they were only given what had initially been offered. (Pew Research Center, 2023).
- Men are more likely than women to say they are satisfied with the pay initially offered (42% vs. 36%), while women are more likely than men to say they don’t feel comfortable asking for higher pay (42% vs. 33%) (Pew Research Center, 2023).
The recruiting process
- 85% of Fortune 500 companies don’t have an optimized job application process (Employ, 2022).
- Only 30% of applicants who start applications with Fortune 500 companies finish their applications (Employ, 2022).
- In 2022, the top reasons candidates had a positive experience with recruiters were attributed to an easy-to-schedule interview (52% of respondents), an easy job application process (51%), and great communication, such as prompt feedback (47%) (Employ, 2022).
- 54% of candidates have abandoned a recruitment process due to poor communication from the recruiter or employer (Criteria, 2023).
- Other top reasons for a positive recruiter-candidate experience included:
- A short hiring process (35% of respondents)
- No cover letter requirement (25%)
- Good explanation of the company’s values, vision, and culture (23%) (Employ, 2022)
- 89% of employers recruited virtually in 2022 (Monster, 2022).
- 19% of employers prefer virtual interviews rather than in-person interviews (Monster, 2022).
- Young recruiters are the biggest proponents of virtual interviews, with 61% of Gen Z recruiters preferring virtual interviews (compared to 26% of Millennials, 13% of Gen X, and 6% of Boomer recruiters) (Monster, 2022).
- 45% of employers say candidates ask about health and safety protocols (Monster, 2022).
- 75% of Gen Z recruiters communicate with candidates by email vs. 50% that do so via text message (Monster, 2022).
- Of candidates who’ve scheduled a job interview with a recruiter over text message, 56% said they prefer texting over email or phone communication (Employ, 2022).
- 37% of job seekers have had a screening or interview via video call (Employ, 2022).
- Of the job seekers who’ve interviewed over video, 59% preferred a video call over a phone call or an in-person interview (Employ, 2022).
- Down from 44% in 2020, 28% of candidates in 2022 preferred recruiters to contact them by email (Employ, 2022).
- Up from 25% in 2020, 28% of candidates in 2022 preferred recruiters to contact them by phone (Employ, 2022).
- 22% of workers have interacted with a chatbot during the recruiting or interview process. Of those, 63% believe the chatbot improved the experience (Employ, 2022).
10+ remote work statistics
Since the pandemic, the rise of remote work has reshaped the modern workplace — and it’s clearly here to stay. These statistics paint a picture of where remote work is heading in 2024.
Employee views on remote work
- When asked about their ideal work situation workers say they want:
- Fully remote work (30%)
- In-office work only (26%)
- Hybrid work with time spent 50/50 in-office and remote (21%)
- Flexibility to decide when and where to work (14%)
- Working remotely 1 to 2 days per week (10%) (Employ, 2022)
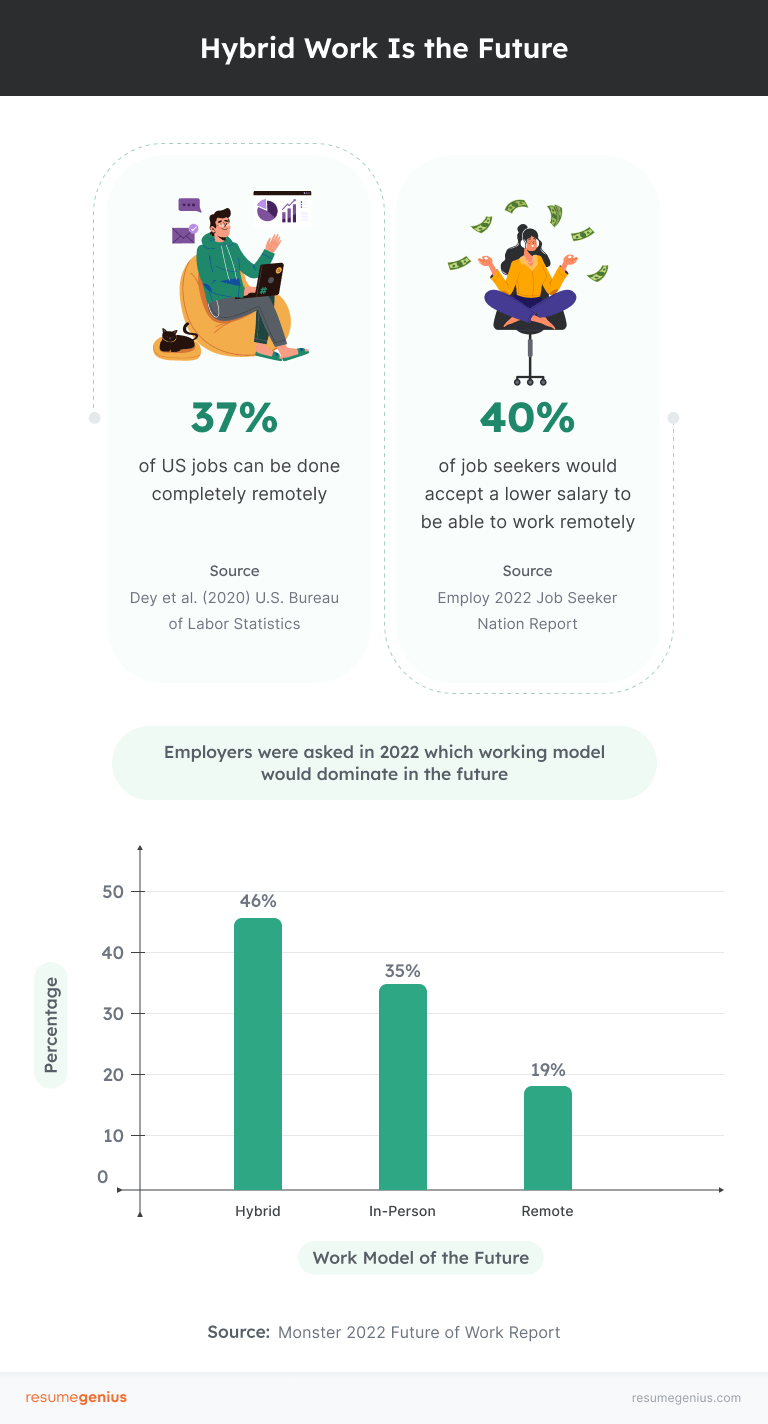
- 40% of job seekers would accept a lower salary to be able to work remotely (Employ, 2022).
- More women than men are motivated by the option of remote work. A total of 16% of women job seekers aged 25 to 54 want a remote job, compared to 11% of same-aged men job seekers (Indeed & Glassdoor, 2023).
The state of remote work in 2024
- As of 2023, 35% of U.S. workers with telework jobs are working from home all the time, a decrease from 43% in January 2022, but significantly higher than the pre-pandemic figure of 7% (Pew Research Center, 2023).
- The proportion of workers in hybrid work environments (working from home some days and at the office on others) has increased to 41%, up from 35% in January 2022 (Pew Research Center, 2023).
- Among workers in hybrid work setups, 63% report that their employer requires in-person work for a certain number of days per week or month (Pew Research Center, 2023).
- 32% of companies surveyed in 2022 said they are likely to expand hybrid and remote work in the coming year (McKinsey & Company, 2022).
- In 2022, 39% of workers were fully in-office, 25% were fully remote, and 16% were hybrid (Employ, Zippia, 2023).
- In the U.S., 46% of employers think hybrid work is the future while 35% of employers think work will be fully in-person and 19% believe work will be fully remote in the future (Monster, 2022).
- Approximately 8.6% of U.S. job postings in 2022 were remote, compared to 2.9% in 2019 (Indeed & Glassdoor, 2023).
- Marketing job postings offering remote work more than tripled between 2019 and 2022 (7.1% in September, 2019 and 27% in September, 2022) (Indeed & Glassdoor, 2023).
- 37% of U.S. jobs can be done completely remotely (Bureau of Labor Statistics, 2020).
- 62% of companies provide training for managers on how to support remote and hybrid employees (McKinsey & Company, 2022).
- 84% of companies ensure remote and on-site employees receive the same company updates (McKinsey & Company, 2022).
- 17% of companies track outcomes, such as promotion and attrition rates, for remote and hybrid employees (McKinsey & Company, 2022).
30+ employee engagement statistics
By examining statistics surrounding worker satisfaction and mental health, managerial styles, and pay, we can see that workers want and need employers to do more for their employees.
General employee engagement statistics
- 86% of workers reported to Indeed that how they feel at work impacts how they feel at home (Indeed & Glassdoor, 2023).
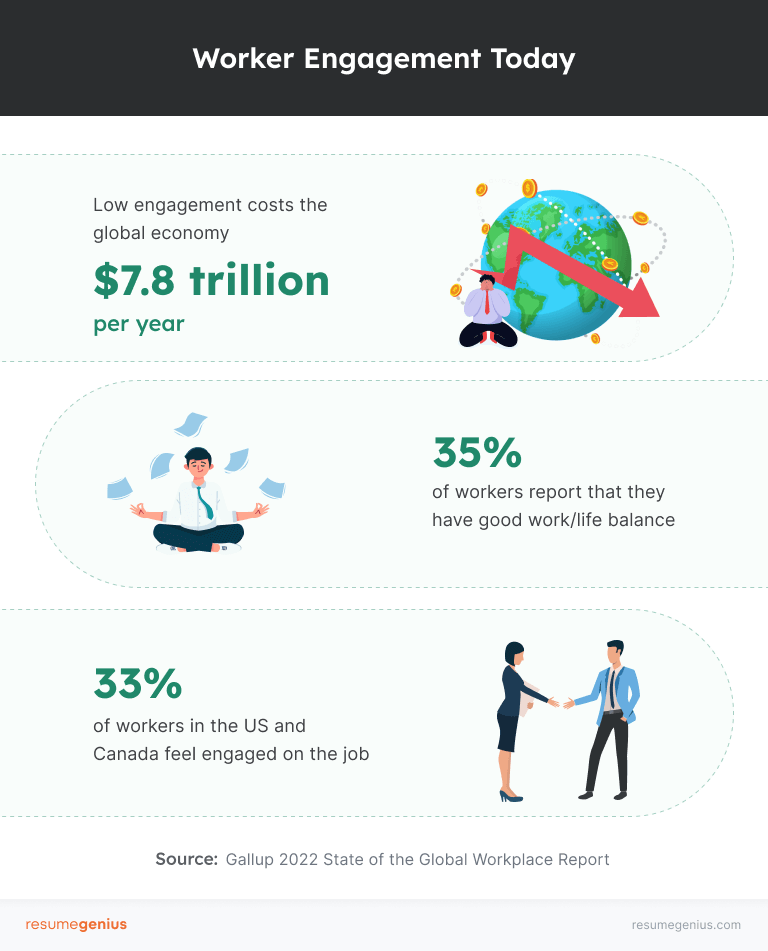
- Low engagement costs the global economy $8.8 trillion USD per year(Gallup, 2023).
- Globally, 51% of currently employed workers said they’re watching for or actively seeking a new job (Gallup, 2023).
- 23% of workers in the U.S. and Canada feel engaged on the job (Gallup, 2023).
- 52% of workers from Canada and the U.S. report “quiet quitting” during their workdays (Gallup, 2023).
Generational differences
- Most young workers (18 to 29 years old) express satisfaction with their jobs, with 85% reporting they are at least somewhat satisfied (Pew Research Center, 2023).
- Young workers show high levels of satisfaction with their relationships with colleagues (65%) and managers (62%), but are divided on their satisfaction with pay and opportunities for promotion (Pew Research Center, 2023).
Management
- About half or more workers say their direct manager or supervisor is excellent or very good when it comes to:
- Giving employees flexibility to balance work and their personal life (63%)
- Giving employees credit when it’s due (56%)
- Staying calm under pressure (56%)
- Setting high standards (53%)
- Being open to new ideas (52%)
- Being clear about expectations (50%)
- Making tough decisions (49%) (Pew Research Center, 2023)
- Employees with a supervisor who is a woman are somewhat more likely to describe their boss as excellent or very good at giving employees credit (59% vs. 54% whose supervisors are men) and significantly more likely to describe their supervisor as caring (63% vs. 55% whose supervisors are men) (Pew Research Center, 2023).
- 43% of employees say their manager shows interest in their careers (McKinsey & Company, 2022).
- 50% of employees say they have a manager who makes sure employees get credit for their work (McKinsey & Company, 2022).
- 60% of employees say their manager gives them helpful feedback (McKinsey & Company, 2022).
- 53% of employees have managers who encourage respectful and inclusive behavior (McKinsey & Company, 2022).
- 62% of employees have managers who check on employees’ wellbeing (McKinsey & Company, 2022).
- 38% of employees have managers who make sure their employees’ workload is manageable (McKinsey & Company, 2022).
Worker satisfaction and mental health
- 35% of workers report that they have a good work/life balance (Employ, 2022).
- 31% of workers report that their employer provides clear communication, and 24% of workers say they get continuous performance feedback (Employ, 2022).
- 40% of employees report an increased workload due to high employee turnover at the end of 2021 and going into 2022 (Employ, 2022).
- 65% of workers believe it takes less than 1 month to determine if a new organization is a good culture fit (Employ, 2022).
- 52% of workers in the U.S. and Canada reported feeling stressed for much of the day (Gallup, 2023).
- In a Resume Genius survey, 82% of workers reported experiencing burnout at their current job (Resume Genius, 2022).
- 63% of workers say the pandemic has caused them to pay more attention to their mental health (Employ, 2022).
- 48% of workers feel comfortable disclosing their mental health challenges to leadership and/or HR (Employ, 2022).
Worker compensation
- Only 37% of workers think they’re paid a fair amount (Employ, 2022).
- 64% of U.S. workers say they’re living comfortably on their present income (Gallup, 2023).
- 60% of U.S. workers reported a wage increase over the previous year (2022 vs. 2021) when they changed employers, compared to 47% of U.S. workers who reported a wage increase but stayed with the same employer (Pew Research Center, 2022).
- 56% of workers with an increased workload due to high employee turnover were not compensated for their extra work (Employ, 2022).
- 28% of workers surveyed in 2022 reported asking for a raise in the past year. Of workers who asked for a raise, 72% received a pay increase (Employ, 2022).
Work benefits and perks
- 83% of large U.S. companies (200+ employees) offer wellness programs, with 53% of small and medium-sized companies (3 to 200 employees) offering these programs (Statista, 2024).
- 58% of U.S. workers have access to some form of flexible work arrangements, either being able to vary their start/end times or work from home at least occasionally. This percentage has remained steady since 2021 (Forbes, 2023).
- 23% of U.S. employers offer mental health benefits and resources (Fortune, 2022).
- Overall, workers expect their job to provide:
- Healthcare (66% of respondents)
- 401k program (49%)
- 401k matching (40%)
- Bonuses (40%)
- Paid family leave (39%)
- Remote work (32%)
- Mental health resources (30%) (Employ, 2022)
- The percentage of U.S. job postings advertising retirement plans, health insurance, and paid time off approximately doubled between January 2019 and May 2022 (Indeed & Glassdoor, 2023).
- 35% of respondents said their employer doesn’t offer learning and development opportunities (Employ, 2022).
- The most common development opportunities employers offer are:
- Paying for continuing education (27% of employers)
- Tuition reimbursement (23%)
- Compensation for conferences (20%)
- Reimbursement for tools and software (17%)
- Succession planning (16%)
- one-on-one mentoring (14%) (Employ, 2022)
- 45% of companies have budgets for team bonding activities (McKinsey & Company, 2022).
7 quitting statistics
- According to BLS, in the fourth quarter of 2023, an average of 1.7 million women and 1.5 million men per month left the labor force (BLS, 2023).
- In any given month in 2022, an average of 53% of women who separated from their last job (compared to 43% of men in the same situation) ended up leaving the labor force (Pew Research Center, 2022).
- The U.S. unemployment rate as of December 2023 is 3.7% (U.S. Bureau of Labor Statistics, 2023).
- 1 in 3 workers would quit a job without having another job lined up (Employ, 2022).
- 1 in 3 new hires would leave a job during the first 90 days (Employ, 2022).
- Of people who left a job within the first 90 days, 41% said their top reason for leaving was that the day-to-day role was not as expected, 35% attributed leaving to a bad experience, 34% said company culture was not as expected, and 32% left because of unsatisfactory leadership (Employ, 2022).
- 35% of workers who ask for a raise and are denied end up leaving their jobs as a result (Employ, 2022).
Learn more about HR and recruitment trends using these resources.
Sources
- Bankrate, “Survey: 56% of Workers Plan to Look for a Job in the Next 12 Months”
- Criteria, “2023 Candidate Experience Report”
- Employ, “2023 Recruiter Nation Report”
- Employ, “2022 Job Seeker Nation Report: Dynamic Motivations of Modern Workers”
- Forbes, “How The Flexible & Remote Work Debate Will Carry Into 2024”
- Forbes, “Is The End Of Remote Work Jobs Approaching?”
- Forbes, “7 Things You Probably Didn’t Know About Your Job Search”
- Fortune, “23% of Workers Say Employers Are Offering New Mental Health Benefits. But Is It Enough?”
- Gallup “Americans Remain Discouraged About Personal Finances”
- Gallup, “State of the Global Workforce 2023 Report”
- Indeed & Glassdoor, “Indeed & Glassdoor’s Hiring and Workplace Trends Report 2023”
- Monster, “Recruitment Survival Guide”
- Monster, “The Future of Work 2022 Global Report”
- McKinsey & Company, “Women in the Workplace 2022”
- Pew Research Center, “Most American Workers Say Their Boss Is Capable, Confident And Fair”
- Pew Research Center, “Young Workers Express Lower Levels Of Job Satisfaction Than Older Ones, But Most Are Content With Their Job”
- Pew Research Center, “When Negotiating Starting Salaries, Most US Women And Men Don’t Ask For Higher Pay”
- Pew Research Center, “About a Third Of U.S. Workers Who Can Work From Home Now Do So All The Time”
- Pew Research Center, “Majority of U.S. Workers Changing Jobs are Seeing Real Wage Gains”
- Resume Genius, Why a 4-day Work Week Won’t Decrease Burnout (Survey Data)
- Statista, “Workplace Health and Wellness in the US – Statistics & Facts”
- U.S. Bureau of Labor Statistics, “Ability to Work From Home: Evidence From Two Surveys and Implications for the Labor Market in the COVID-19 Pandemic”
- U.S. Bureau of Labor Statistics, “Labor Force Statistics from the Current Population Survey (December, 2023)”
- U.S. Bureau of Labor Statistics, “The Employment Situation — December 2023”
- Zippia, “25 Trending Remote Work Statistics [2023]: Facts, Trends, And Projections”
Methodology
In addition to the research on U.S. employment and recruitment cited here, we have calculated labor force inflows and outflows for women and men based on the seasonally adjusted average of employment movement for October, November, and December 2023 from the U.S. Bureau of Labor Statistics Labor Force Statistics from the Current Population Survey.
About Resume Genius
Since 2009, Resume Genius has combined innovative technology with leading industry expertise to simplify the job hunt for people of all backgrounds and levels of experience.
Resume Genius’s easy-to-use resume builder and wide range of free career resources, including resume templates, cover letter samples, and resume writing guides, help job seekers find fulfilling work and reach their career goals. Resume Genius is led by a team of dedicated career advisors and HR experts and has been featured in The New York Times, Forbes, CNBC, and Business Insider.
For media inquiries, please contact us.