

To find out what jobs are at risk of shrinking due to AI, we analyzed four major AI exposure studies across 778 U.S. occupations that employ 98.6% of U.S. workers. We then compared the results with BLS employment projections through 2035 to assess which jobs are still growing despite high AI exposure.
The studies largely agree on which jobs AI is most likely to change, and those jobs are splitting in two. Higher-paid jobs that typically need a bachelor’s degree are projected to keep growing. Lower-paid office and customer service jobs are projected to shrink.
1. Many of the jobs most exposed to AI are still projected to grow
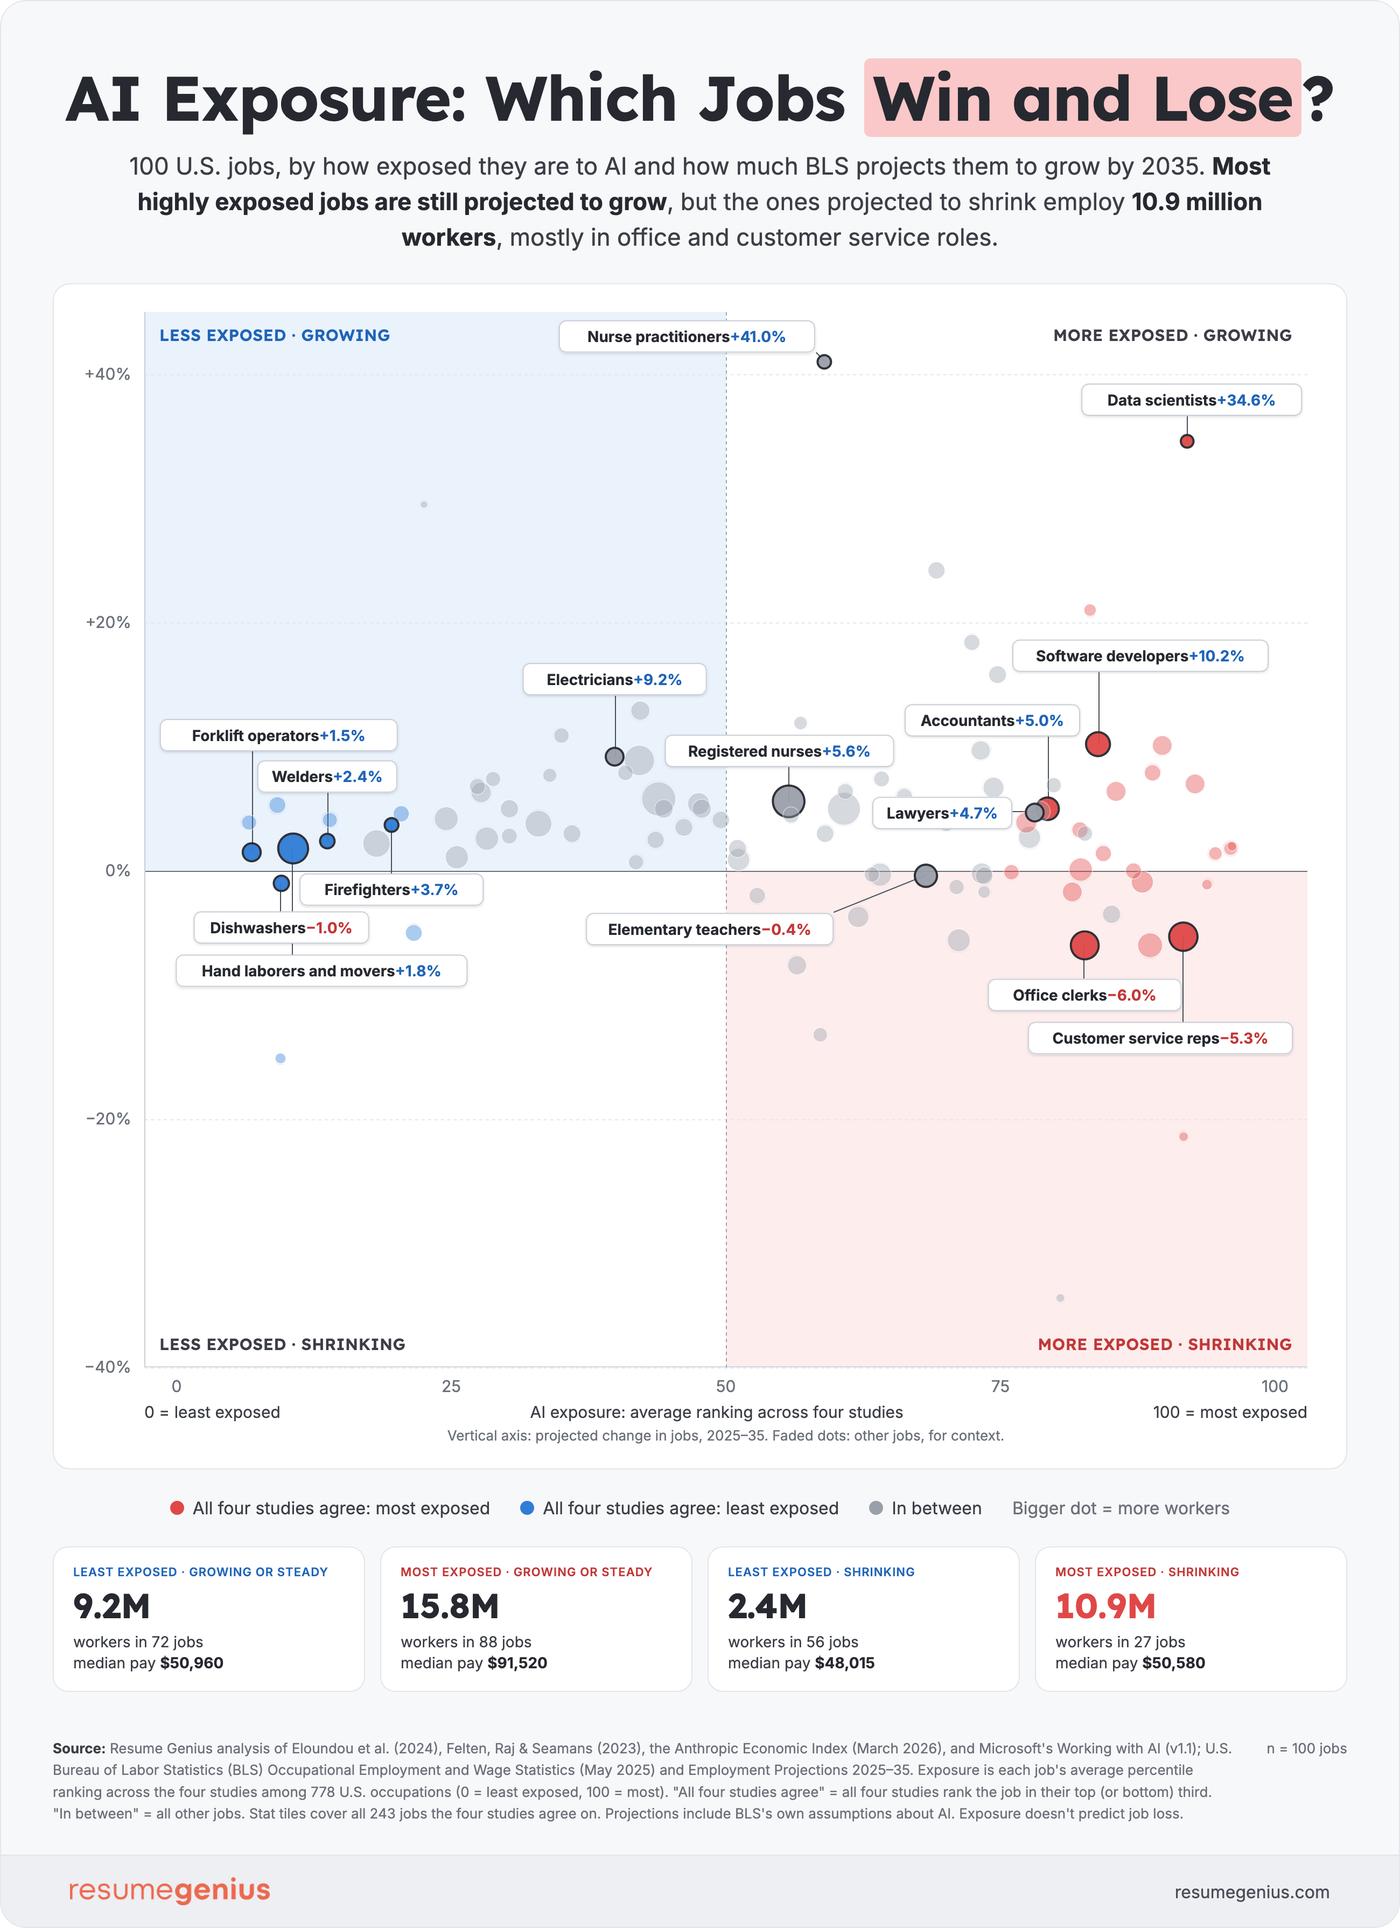
Customer service representatives and software developers are two jobs considered highly exposed to AI by all four studies. Yet the BLS projects customer service jobs to shrink 5.3% by 2035 and software developer jobs to grow 10.2% over the same period.
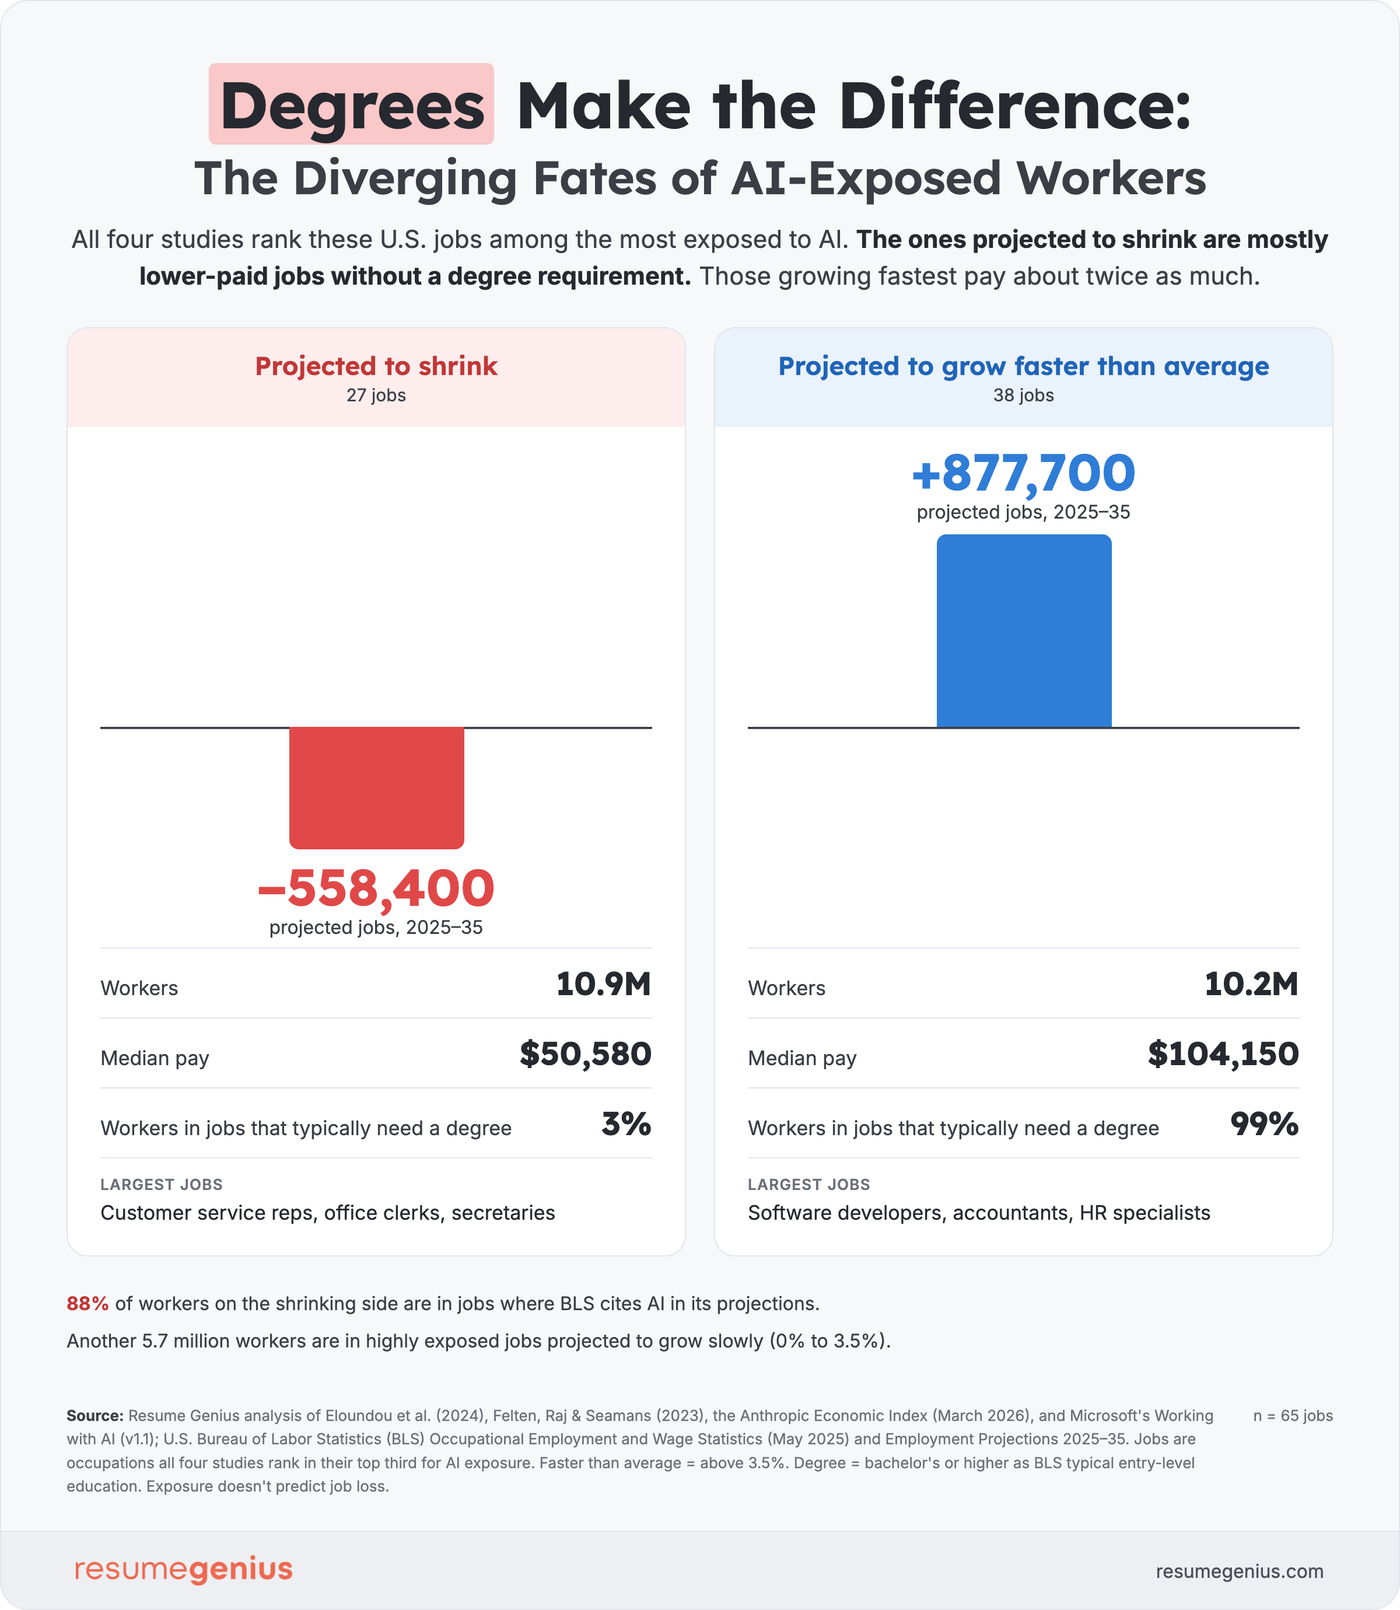
The divide is clear across all four studies: 115 jobs rank among the most AI-exposed, employing 26.7 million people (about 1 in 6 U.S. workers). While 59% are projected to grow, 27 jobs, including customer service representatives and office clerks, are expected to shrink by 2035. Another 38, including software developers, accountants, and data scientists, are projected to grow faster than the 3.5% average for all jobs.
| AI-Exposed Jobs | Projected to shrink | Projected to grow faster than average |
|---|---|---|
| # of Jobs | 27 | 38 |
| Total Employees | 10.9 million | 10.2 million |
| Median pay | $50,580 | $104,150 |
| Workers in jobs that typically need a bachelor's degree | 3% | 99% |
| Projected job change, 2025–35 | −558,400 | +877,700 |
Jobs all four studies rank among the most exposed to AI.1–4 Another 50 jobs with 5.7 million workers are projected to grow slowly (0% to 3.5%). Projections: BLS Employment Projections, 2025–35.7
The two groups are almost the same size, but they look very different. One is mostly lower-paid office and customer service work. The other is mostly higher-paid analyst, finance, and tech work that typically needs a degree.
2. The winners: tech, finance, and analyst jobs that need a degree
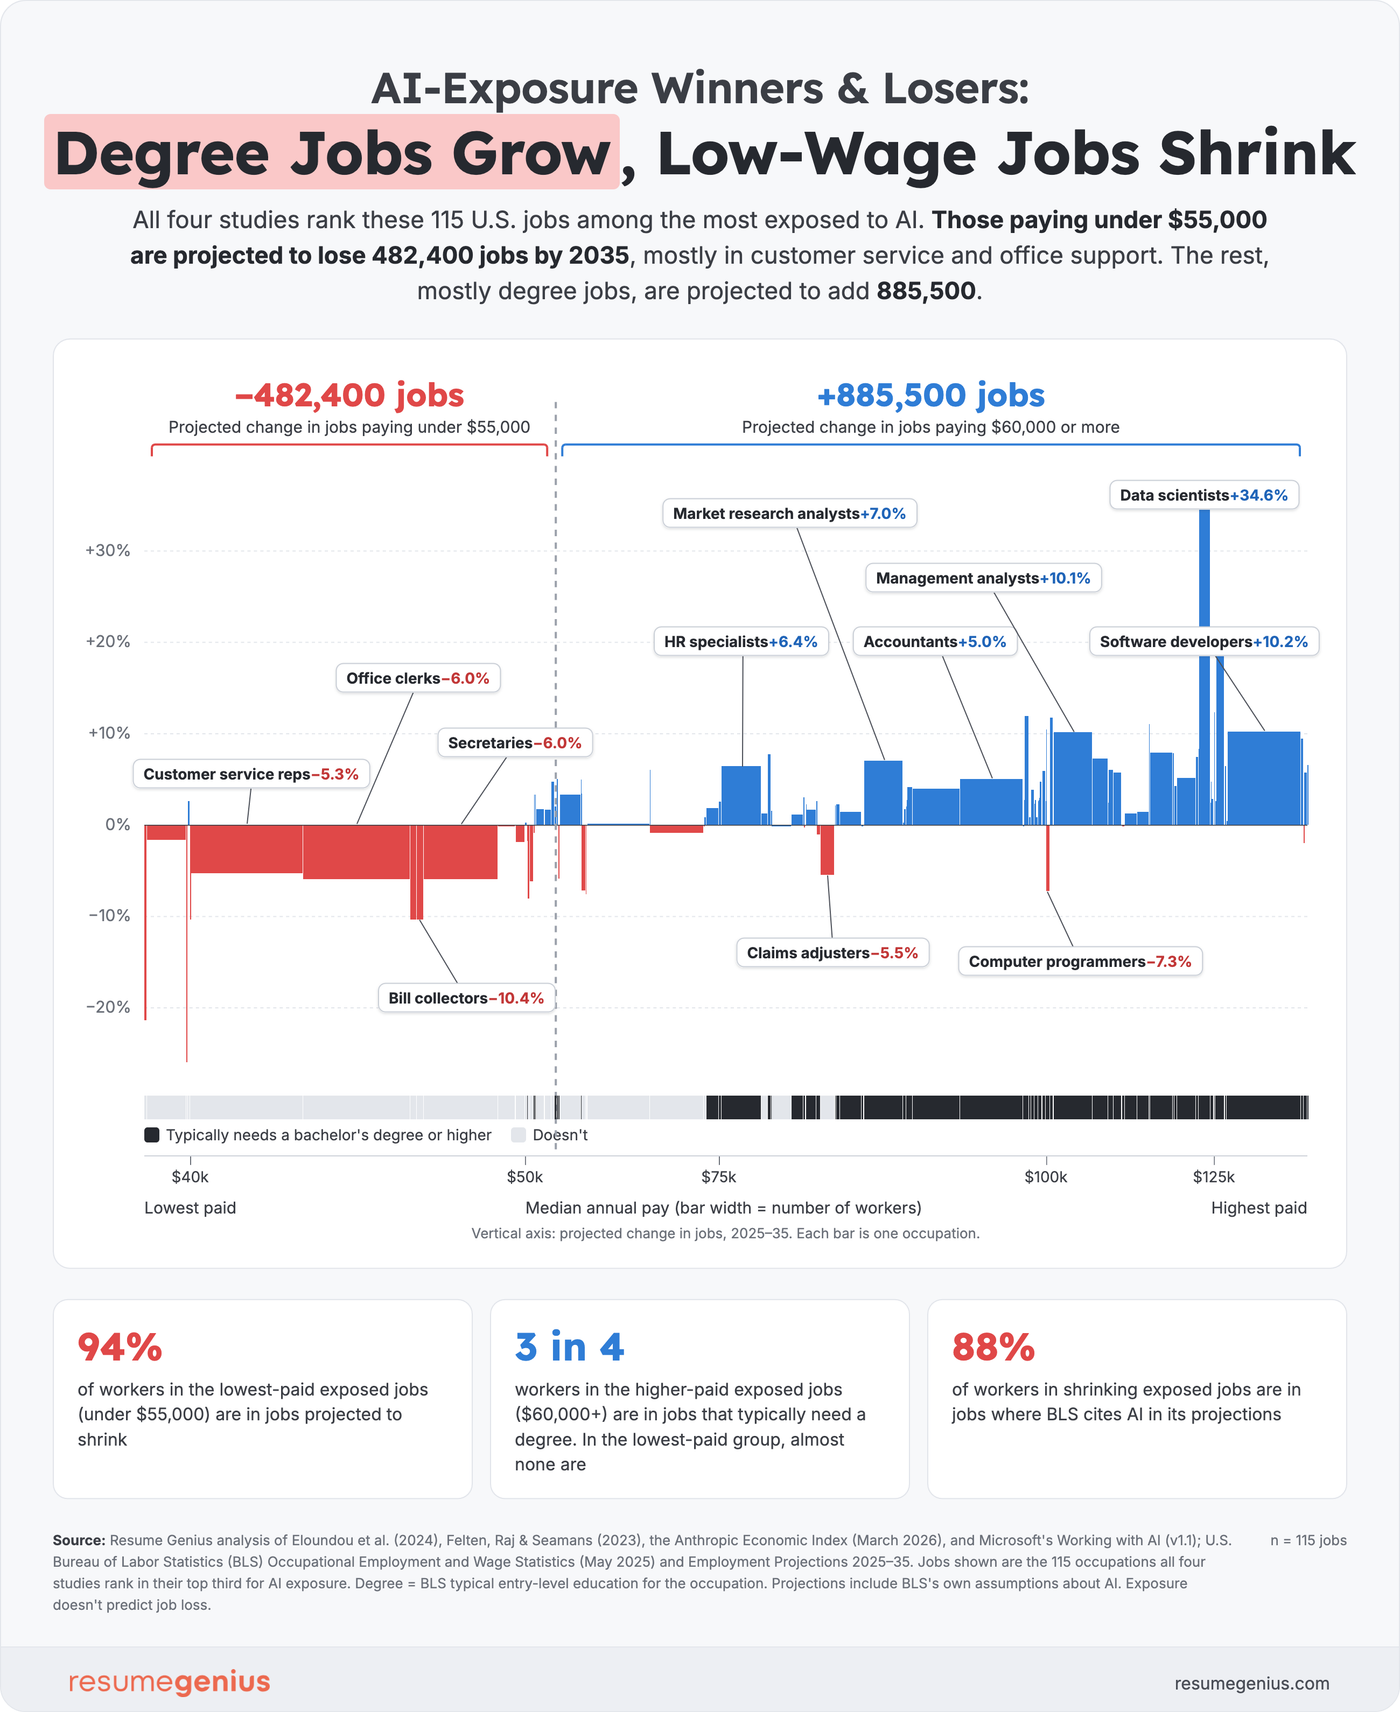
The exposed jobs projected to grow fastest are mostly well-paid jobs that typically need a degree. Among the jobs all four studies rank most exposed, 38 are projected to grow faster than average. They employ 10.2 million workers, pay a median $104,150, and are projected to add 877,700 jobs by 2035.
These are mostly business, finance, and tech roles, which hold 94% of the group’s workers. Almost all of these workers (99%) are in jobs that typically need a bachelor’s degree, and 24 of the 38 jobs pay a median of six figures. Data scientists are projected to grow fastest (+34.6%), and software developers to add the most jobs (+174,700).
| Job | Median pay | Projected growth, 2025–35 |
|---|---|---|
| Data scientists | $120,230 | +34.6% |
| Software developers | $135,980 | +10.2% |
| Management analysts | $101,860 | +10.1% |
| Computer systems analysts | $105,850 | +7.9% |
| Financial and investment analysts | $102,740 | +7.2% |
| Market research analysts and marketing specialists | $78,760 | +7.0% |
| Human resources specialists | $75,940 | +6.4% |
| Accountants and auditors | $83,680 | +5.0% |
The eight largest jobs that all four studies rank most exposed1–4 and BLS projects to grow faster than average (above 3.5%),7 excluding “All Other” categories. Sorted by projected growth. Median pay: BLS, May 2025.8
A degree isn’t a guarantee, though. A few degree jobs are among the most exposed and still projected to shrink, including computer programmers (−7.3%), news reporters and journalists (−5.9%), and editors (−1.1%). Programming shows how close the line can be: BLS projects software developer jobs to grow 10.2% while computer programmer jobs shrink.
3. The losers: lower-paid office and customer service jobs
The exposed jobs projected to shrink are mostly lower-paid jobs that don’t typically need a degree. Among the jobs all four studies rank most exposed, 27 are projected to shrink by 2035. They employ 10.9 million workers, pay a median $50,580, and are projected to lose 558,400 jobs.
Office and administrative support jobs make up 81% of the workers in this group, and only 3% of the group’s workers are in jobs that typically need a bachelor’s degree. Customer service representatives, general office clerks, and secretaries alone account for 6.8 million workers. Telemarketers face the steepest projected decline among larger jobs (−21.4%).
| Job | Median pay | Projected growth, 2025–35 |
|---|---|---|
| General office clerks | $45,010 | −6.0% |
| Secretaries and administrative assistants | $47,540 | −6.0% |
| Claims adjusters, examiners, and investigators | $78,000 | −5.5% |
| Customer service representatives | $44,770 | −5.3% |
| Insurance claims and policy processing clerks | $49,230 | −1.9% |
| Receptionists and information clerks | $38,010 | −1.7% |
| Wholesale and manufacturing sales representatives | $72,080 | −0.9% |
| Billing and posting clerks | $48,500 | −0.1% |
The eight largest jobs that all four studies rank most exposed1–4 and BLS projects to shrink.7 Sorted by projected decline, largest first. Median pay: BLS, May 2025.8
BLS itself points to AI for most of these jobs. For jobs holding 9.6 million of the 10.9 million workers in this group (88%), BLS names AI among the reasons for its projection. For customer service representatives, for example, it expects AI to handle more customer interactions.
Not every job without a degree requirement is losing ground
The jobs AI is least likely to change don’t typically need a degree either, and most of them are still growing. All four studies rank 128 occupations among the least exposed to AI, employing 11.6 million workers. None typically requires a bachelor’s degree. BLS projects 72 of them, with 9.2 million workers (79%), to grow or hold steady by 2035.
These growing jobs pay a median $50,960, almost the same as the shrinking office jobs above. The difference is the kind of work: they involve physical, hands-on tasks such as moving freight, operating machinery, welding, and firefighting.
| Job | Median pay | Projected growth, 2025–35 |
|---|---|---|
| Medical equipment preparers | $47,700 | +10.8% |
| Aircraft mechanics and service technicians | $79,870 | +5.4% |
| Dining room and cafeteria attendants and bartender helpers | $33,980 | +5.3% |
| Installation, maintenance, and repair helpers | $39,630 | +5.3% |
| Construction equipment operators | $59,850 | +4.6% |
| Laundry and dry-cleaning workers | $34,890 | +4.3% |
| Tree trimmers and pruners | $50,960 | +4.2% |
| Firefighters | $59,280 | +3.7% |
| Welders, cutters, solderers, and brazers | $53,750 | +2.4% |
| Hand laborers and freight, stock, and material movers | $40,240 | +1.8% |
Jobs that all four studies rank least exposed to AI:1–4 the seven fastest-growing with at least 50,000 workers, plus firefighters, welders, and hand laborers and freight movers. Median pay: BLS, May 2025.8 Projections: BLS, 2025–35.7
4. Where the studies disagree, and what it means for your job
The four studies agree on most jobs, but not all of them. Most of that disagreement comes from the two studies that track how people actually use AI chatbots: Anthropic’s (Claude) and Microsoft’s (Bing Copilot).
The two usage studies rank jobs the least alike of any pair. When three studies agree on a job and the fourth doesn’t, the odd one out is usually one of the two chatbot usage studies, about three times out of four. That’s why a headline based on a single study can make a job look more or less exposed to AI than it really is.
Some jobs may look more exposed than they are
Usage studies match each chatbot conversation to the job task it most resembles. A shopper asking which laptop to buy looks a lot like a salesperson recommending merchandise, so that conversation can count toward retail salespersons.
Questions from shoppers like this likely help explain why retail salespersons rank so high in both usage studies. It’s the largest job BLS rates “very high” for AI exposure, with 3.9 million workers. Both usage studies place the job in the 88th percentile, while the two studies of what AI could do rank it only a little above average. About three-quarters of its Anthropic score comes from two customer-facing tasks: recommending merchandise and working out what customers need.
The same pattern shows up elsewhere. Restaurant cooks’ usage comes largely from recipe and menu tasks that home cooks ask about too. Microsoft’s high scores for some service jobs, such as social workers, come from general advice activities that members of the public may be asking about for themselves.
Some jobs may face more change than their ratings show
For other jobs, chatbot usage comes from the core work itself, which may mean more change ahead. Bookkeeping clerks, for example, rank high on both usage studies, and their scores come from core parts of the job: recording financial data, compiling reports, and doing calculations. BLS projects the job to shrink 5.6% by 2035.
| Retail salespersons | Bookkeeping, accounting, and auditing clerks | |
|---|---|---|
| Workers | 3.9 million | 1.4 million |
| Studies of what AI could do (Eloundou / Felten) | 61st / 59th percentile | 54th / 72nd percentile |
| Studies of how people use AI (Anthropic / Microsoft) | 88th / 88th percentile | 81st / 79th percentile |
| Biggest task behind the Anthropic score | Recommending and helping locate merchandise (42%) | Recording financial data (46%) |
| Projected growth, 2025–35 | −0.3% | −5.6% |
Percentile: where the job ranks among 778 jobs in each study, from 0 (least exposed) to 100 (most exposed).1–4 Biggest task: the job task that makes up the largest share of the job’s Anthropic score.1 Workers: BLS, May 2025.8 Projections: BLS, 2025–35.7
Paralegals show how much one study can change the picture. People use Claude heavily for paralegals’ core task, preparing legal documents such as briefs, contracts, and wills, so Anthropic ranks the job in the 74th percentile. Microsoft’s Copilot data ranks it in the 15th. Both studies of what AI could do rank paralegals high, closer to Anthropic’s view.
Methodology
We analyzed four widely cited studies of AI exposure across 778 U.S. occupations, which employ 153.3 million workers (98.6% of employment in BLS wage data). We then compared the results with BLS employment projections.
How solid are these findings?
A quick reference for anyone checking the backbone of the report. Details follow below.
- The four studies largely agree. Across all 778 jobs, the studies’ rankings agree strongly overall (Kendall’s W = 0.81). The two studies of what AI could do are the most alike pair (rank correlation 0.85), and the two usage studies the least alike (0.69).
- Big disagreements are rare. About 1 in 20 workers are in a job where the studies’ rankings sit more than 50 percentile points apart.
- The results line up with BLS’s new ratings. For 87% of workers in jobs BLS rates “very high,” at least three of the four studies agree the job is among the most exposed (82% for “low”). Of the 115 jobs all four studies rank most exposed, BLS rates 103 “very high” and the other 12 “high.” Across all jobs, 80% land in the same exposure quarter as their BLS rating. BLS based its ratings partly on the same research, so this is a consistency check.
- No single task drives the results. When no task may supply more than half of a job’s Anthropic score, 92% of jobs stay in the same group, including every job named in this report.
- Other ways of scoring give the same answer. Every alternative version of the analysis ranks jobs very similarly to the main one (rank correlation above 0.92).
- “Winners” and “losers” are projections. They refer to jobs all four studies rank most exposed that BLS projects to grow faster than average (above 3.5%) or to shrink (below 0%) by 2035. BLS projections already include the agency’s own assumptions about AI, and BLS names AI as a reason for jobs holding 88% of workers in the shrinking group.
- “Degree” describes the job. It means the typical entry-level education BLS lists for the occupation. It doesn’t measure what education individual workers have.
- Exposure isn’t job loss. A high score means AI could do, or is already used for, many of a job’s tasks. Our findings show associations between exposure, pay, education, and projected growth, and don’t show causes.
- Usage data has blind spots. The usage studies reflect Claude and Bing Copilot users only and may include customers asking for themselves (see section 4).
The four studies:
Two estimate which job tasks AI could do:
- Eloundou, Manning, Mishkin, and Rock (2024), “GPTs are GPTs.” Human raters judged whether a large language model could cut the time each job task takes by at least half. We use the share of a job’s tasks rated exposed, counting tasks that need extra software at half weight.
- Felten, Raj, and Seamans (2023), language-modeling AI Occupational Exposure. Measures how closely the abilities a job requires match what language models can do.
Two measure which tasks people actually use AI for:
- Anthropic Economic Index (March 2026 release). Conversations on Claude.ai and Anthropic’s API, matched to job tasks. A job’s score is the share of conversations matched to each of its tasks, weighted by how important each task is to the job and averaged over all of its tasks. Tasks with no recorded use count as zero.
- Microsoft, Working with AI (v1.1). Bing Copilot conversations from 2024, matched to work activities and combined with how successfully the AI completed them, giving an AI applicability score for each job.
Rankings: Each study uses its own scale, so we ranked every job from least to most exposed within each study, as a percentile from 0 to 100. Ranking puts the studies on the same footing. It also removes differences in overall level, so the comparison shows which jobs rank high or low. It doesn’t measure how much AI is used.
Groups:
- Most exposed (all four agree): all four studies rank the job in their top third (115 jobs).
- Least exposed (all four agree): all four rank it in their bottom third (128 jobs).
- Usage studies split: two studies of the same type rank the job at least 50 percentile points apart (36 jobs; in 34, the two usage studies).
- We set these thresholds before looking at the results.
Stability check: Some jobs’ Anthropic scores depend heavily on a single task. We recalculated every job’s group with no single task allowed to supply more than half of its Anthropic score. 715 of 778 jobs (92%) stay in the same group. Every job named in this report is one of them.
Projected growth: Projections come from BLS Employment Projections, 2025–35. We grouped jobs as shrinking (below 0%), growing slowly (0% to 3.5%), or growing faster than average (above 3.5%, the projected growth for all jobs). Projected job change uses BLS’s employment base, which includes self-employed workers. BLS projections already include the agency’s own assumptions about AI, so they aren’t an independent test of the studies.
Comparison with BLS’s AI exposure ratings: BLS published its own AI exposure ratings (low, moderate, high, and very high) alongside its 2025–35 projections. When we split all 778 jobs into four equal groups by their average ranking, 80% land in the same group as their BLS rating, and none is more than one group apart. BLS based its ratings partly on the same research, so we treat this as a consistency check. All rankings and groups in this report come from the four studies we analyzed.
Sensitivity checks: We reran the analysis using each Anthropic platform on its own, unweighted tasks, the share of a job’s tasks in use, a cap on any single task, and task descriptions shared between jobs split by employment. Every version ranks jobs very similarly to the main one (rank correlation above 0.92). Leaving out any one study, no job drops out of either “all four agree” group.
Data: Employment and median pay come from BLS Occupational Employment and Wage Statistics, May 2025. Projected growth, projected job change, and typical entry-level education come from BLS Employment Projections, 2025–35. “Median pay” for a group is the median of each job’s median annual wage. Shares of workers use OEWS employment.
Coverage: Of 830 detailed occupations in the BLS wage data, 778 have scores in all four studies. The other 52, employing 2.1 million workers, are left out. Studies that use older occupation codes were mapped to 2018 codes using the BLS crosswalk.
Limitations:
- Exposure isn’t job loss. A high score means AI could do, or is already used for, many of a job’s tasks. It doesn’t predict layoffs.
- The usage studies reflect Claude and Bing Copilot users only. Both match conversations to the job task they most resemble, so some usage may come from people outside the job, such as customers asking for themselves.
- All four studies describe jobs using the U.S. Department of Labor’s O*NET task and ability data, so some of their agreement reflects that shared starting point.
- Rankings are relative. A job in the bottom third still has some exposure.
- Projections are BLS’s expectations of what will happen. Our findings show associations and can’t show causes.
This report includes information from the O*NET 20.1 Database by the U.S. Department of Labor, Employment and Training Administration (USDOL/ETA). Used under the CC BY 4.0 license. O*NET® is a trademark of USDOL/ETA. Resume Genius has modified all or some of this information. USDOL/ETA has not approved, endorsed, or tested these modifications. Microsoft Working with AI data is used under CC BY 4.0; Resume Genius’s use doesn’t imply Microsoft endorsement.
FAQ
What does it mean for a job to be “exposed” to AI?
A job is exposed to AI when AI could do, or is already used for, many of its tasks. Exposure shows which jobs are most likely to change. It doesn’t predict whether a job will shrink: among the jobs all four studies rank most exposed, BLS projects most to keep growing.
Which jobs are most exposed to AI?
All four studies we analyzed rank 115 jobs among the most exposed, employing 26.7 million U.S. workers. The largest are customer service representatives, general office clerks, secretaries and administrative assistants, software developers, and accountants and auditors.
Which jobs are least exposed to AI?
All four studies rank 128 jobs among the least exposed, employing 11.6 million workers. Most involve physical work, such as hand laborers and freight movers, industrial truck operators, construction equipment operators, welders, and firefighters.
Is software development at risk from AI?
All four studies rank software developers among the most exposed jobs, and Anthropic’s Claude usage data ranks the job higher than almost any other. But BLS projects software developer jobs to grow 10.2% by 2035, adding about 174,700 jobs, faster than the 3.5% average for all jobs.
How does this compare with BLS’s AI exposure ratings?
Our results line up closely with the ratings BLS published in August 2026. For nearly 9 in 10 workers in jobs BLS rates “very high,” at least three of the four studies agree the job is among the most exposed. The difference is detail: BLS gives each job one rating, while this report shows what each of the four studies says about it.
Sources
- Anthropic, Anthropic Economic Index
- Eloundou, Manning, Mishkin, and Rock, GPTs are GPTs
- Felten, Raj, and Seamans, AI Occupational Exposure (AIOE) data
- Microsoft, Working with AI
- O*NET Resource Center, O*NET Database
- U.S. Bureau of Labor Statistics, AI Exposure Categories
- U.S. Bureau of Labor Statistics, Employment Projections
- U.S. Bureau of Labor Statistics, Occupational Employment and Wage Statistics
About Resume Genius
Since 2009, Resume Genius and its resume builder software have been helping people from all backgrounds and experience levels land their next jobs faster.
Resume Genius also provides a wide range of free career resources, including customizable resume templates, resume examples for different industries, and resume writing guides, to help job seekers find fulfilling work and reach their career goals.
Resume Genius is led by a team of dedicated career advisors and HR experts and has been featured in The New York Times, Harvard Business Review, Fast Company, CNBC, and USA Today.
For media inquiries, please contact us.
About the Author

Jack Hulatt graduated from the University of Greenwich with a bachelor’s degree in Politics and International Relations before pursuing certifications in computer science and data analytics. In his short career, he has already worked on multiple entrepreneurial projects and as part of a larger team, giving him direct insight into the needs and wants of young job seekers today.