- Salary and compensation statistics: it’s still about the money
- Work–life balance statistics: the new #1 priority?
- Employee benefit statistics: misaligned priorities
- Management impact statistics: good boss, bad boss
- Demographic trends: who’s happiest at work?
- Outlook statistics: the future of work and employee loyalty
- Surprising statistics about job satisfaction
- Conclusion
- Frequently asked questions about job satisfaction
- Sources
- About Resume Genius
To understand what truly drives happiness at work today, we analyzed job satisfaction statistics on everything from salary and burnout to the surprising impact of AI.
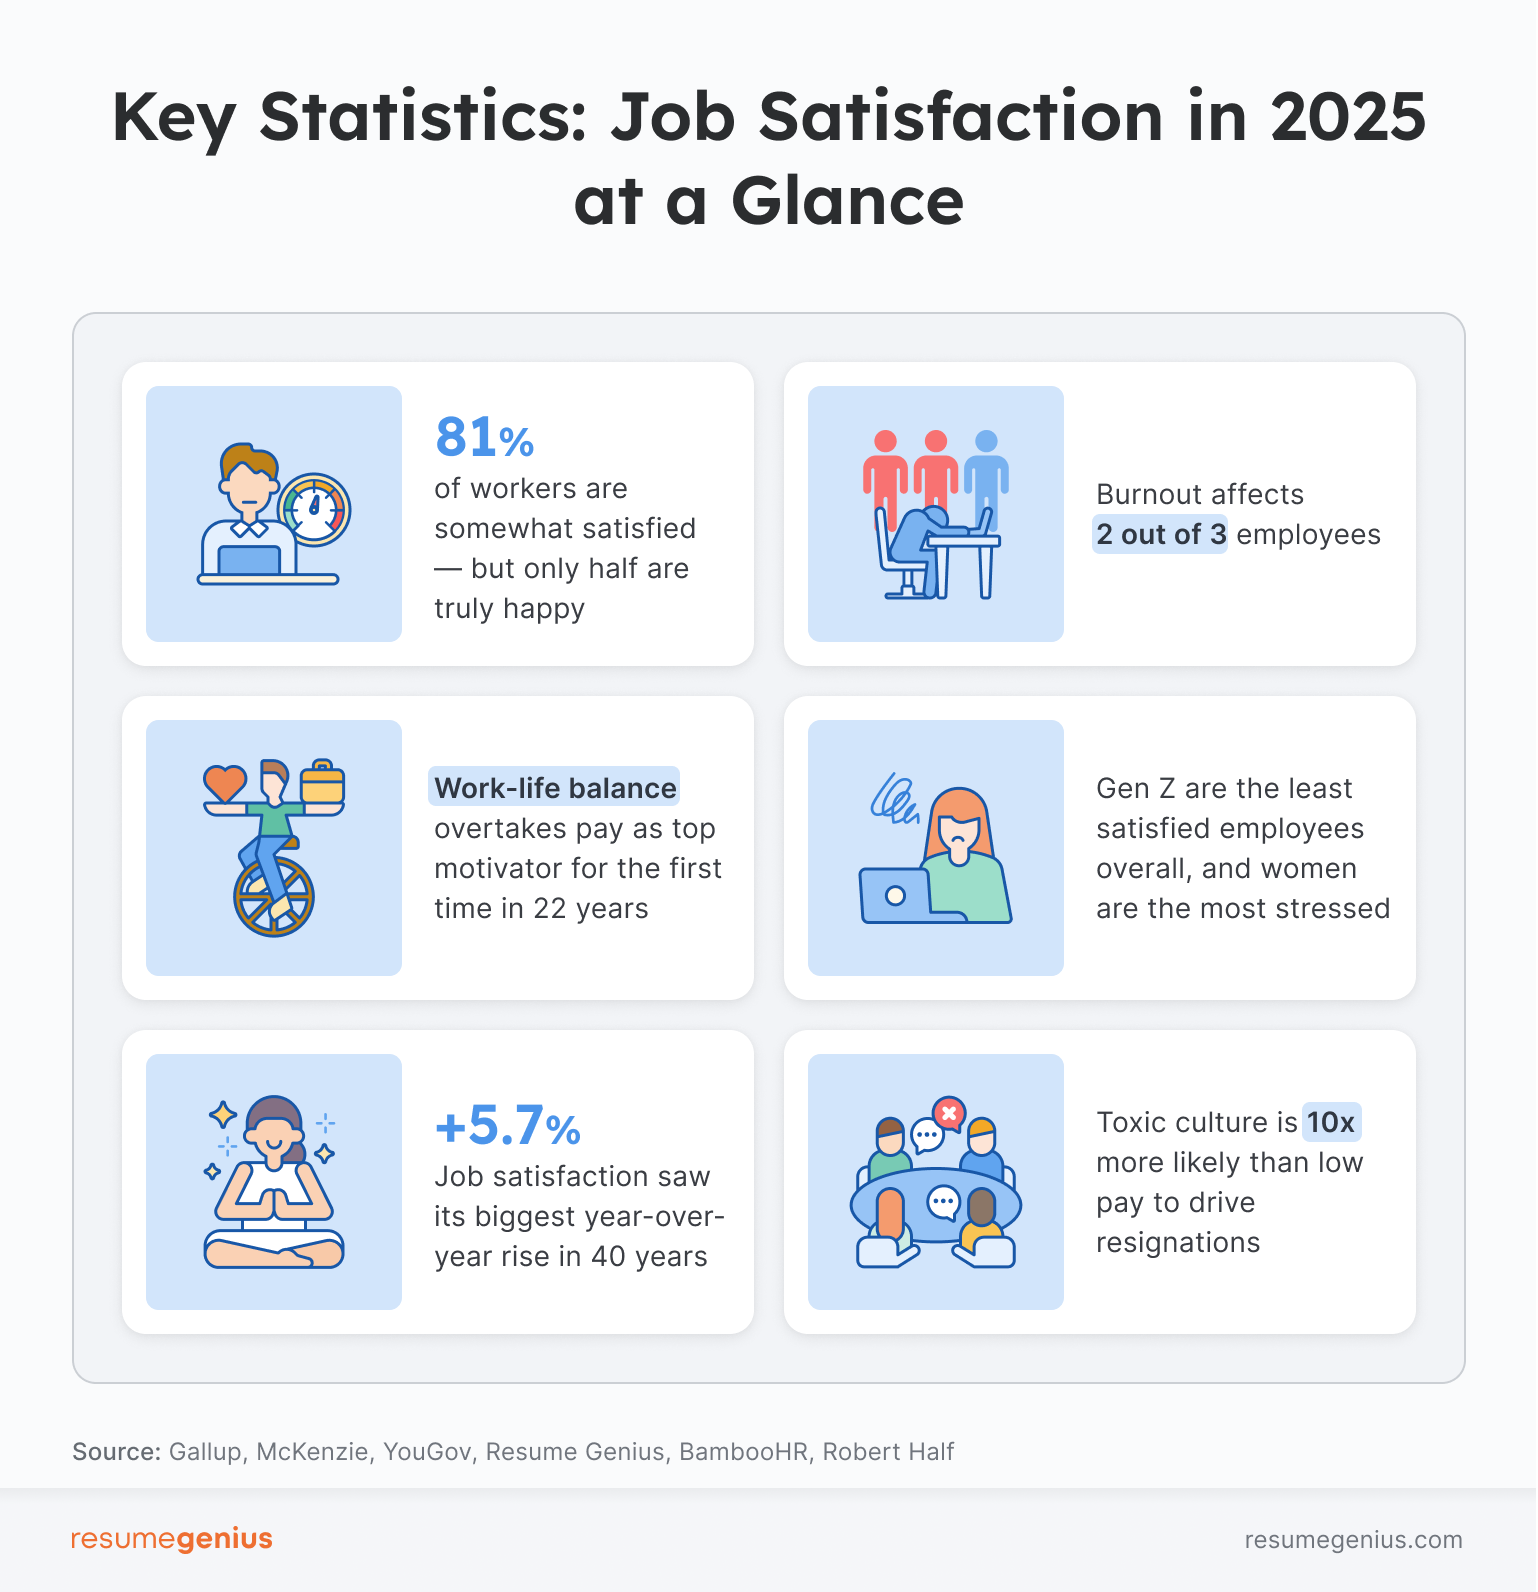
- 81% of workers say they’re somewhat satisfied – but only half are truly happy
- Work-life balance overtakes pay as top motivator for the first time in 22 years
- Overall job satisfaction is up 5.7% – the biggest year-over-year rise in 40 years
- In 2025, women’s overall job satisfaction (68.8%) surpassed that of men’s (67.9%) for the first time since 2011
- Burnout affects 2 out of 3 employees
- Gen Z are the least satisfied employees overall, and women are the most stressed
- Toxic culture is 10x more likely than low pay to drive resignations
Salary and compensation statistics: it’s still about the money
Money remains one of the most important factors in job satisfaction, so understanding how employees feel about their compensation is crucial. The data reveals how workers perceive their compensation packages, and the broader unpredictable economic realities surrounding rising costs of living.
Employee sentiment on pay
Pay dissatisfaction isn’t just about the numbers: it’s related to perceived fairness. The data shows that workers are increasingly linking their frustration to a sense that company leadership is disconnected from financial reality.
Only 30% of workers say they’re “extremely or very satisfied” with their pay — a 4-point drop from last year (Pew Research Center, 2024). Pay now ranks as the top source of workplace friction.
This frustration is fueled by a perceived leadership gap:
- 61% of Americans believe executives are “out of touch” with their struggles
- 55% feel their CEO is overpaid (BambooHR, 2024)
Wages vs. inflation
While official data shows that wages are outpacing inflation, this “real pay increase” isn’t felt by half the workforce. This pressure is compounded by a persistent gender pay gap, with men seeing raises at nearly double the rate of women.
According to the U.S. Bureau of Labor Statistics (2025):
- Wages and salaries increased 3.9% for the 12 months ending in June 2025
- The Consumer Price Index increased 2.9% for the 12 months ending in August 2025
This 1% real pay increase isn’t making life easier for workers: half of employees say they’re struggling to make ends meet (BambooHR, 2024).
Gender pay inequality compounds the problem. Men received an average salary increase of 4.8% over the last year, nearly double the 2.7% received by women (BambooHR, 2024).
This could contribute towards 39% of women reporting negative feelings about their pay, compared to 27% of men (BambooHR, 2024).
Job seeking behavior
A shift in the power dynamic between workers and employers is underway, driven by dissatisfaction with pay and transparency. Workers now see pay secrecy as a “red flag” during their job search, and younger generations are actively pushing for public accountability with fair pay.
- Only 25% of workers say they plan to look for a new role in the next six months, down from 35% in July 2024 (Robert Half, 2025)
- 41% of workers consider the absence of a salary range in a job description a “red flag” (Robert Half, 2025)
- 50% of Gen Z think employers should be named and shamed online to prevent workplace misconduct (Resume Genius, 2025)
Work–life balance statistics: the new #1 priority
What matters most to workers in 2025? While overall job satisfaction seems to be rising, a closer look reveals genuine happiness at work is harder to find, and a healthy work–life balance is now paramount for workers.
Overall satisfaction
Headline numbers show a historic rise in general job satisfaction, but the data reveals a troubling decline in the share of workers who describe themselves as highly satisfied, suggesting a workforce that’s more lukewarm than truly fulfilled.
- Overall job satisfaction rose by 5.7 percentage points in the past year, the biggest increase in nearly four decades
- 81% of workers say they’re “generally satisfied” with their jobs, but only about half feel extremely or very satisfied
- The share of highly satisfied workers has dropped by 3–7 points this year, with notable declines in satisfaction related to pay, benefits, and management feedback
- Self-employed professionals are considerably happier, with 60% reporting high satisfaction compared to 49% of traditionally employed workers
Employee priorities
Work–life balance has officially surpassed pay as the top motivator for employees in 2025. Many employees are now willing to sacrifice higher salaries in favor of a healthy work–life balance. This new mindset also prioritizes “values alignment” over a job that simply pays the bills.
- For the first time in 22 years, work–life balance has overtaken pay as the leading motivator for the global workforce (Randstad, 2025)
- Nearly a quarter (23%) of job seekers say they would accept an average pay cut of 5.4% for a role that offers better balance or other non-monetary benefits (BambooHR, 2025)
- 48% of global employees say they wouldn’t accept a job with a company which has values that don’t align with their own (Randstad, 2025)
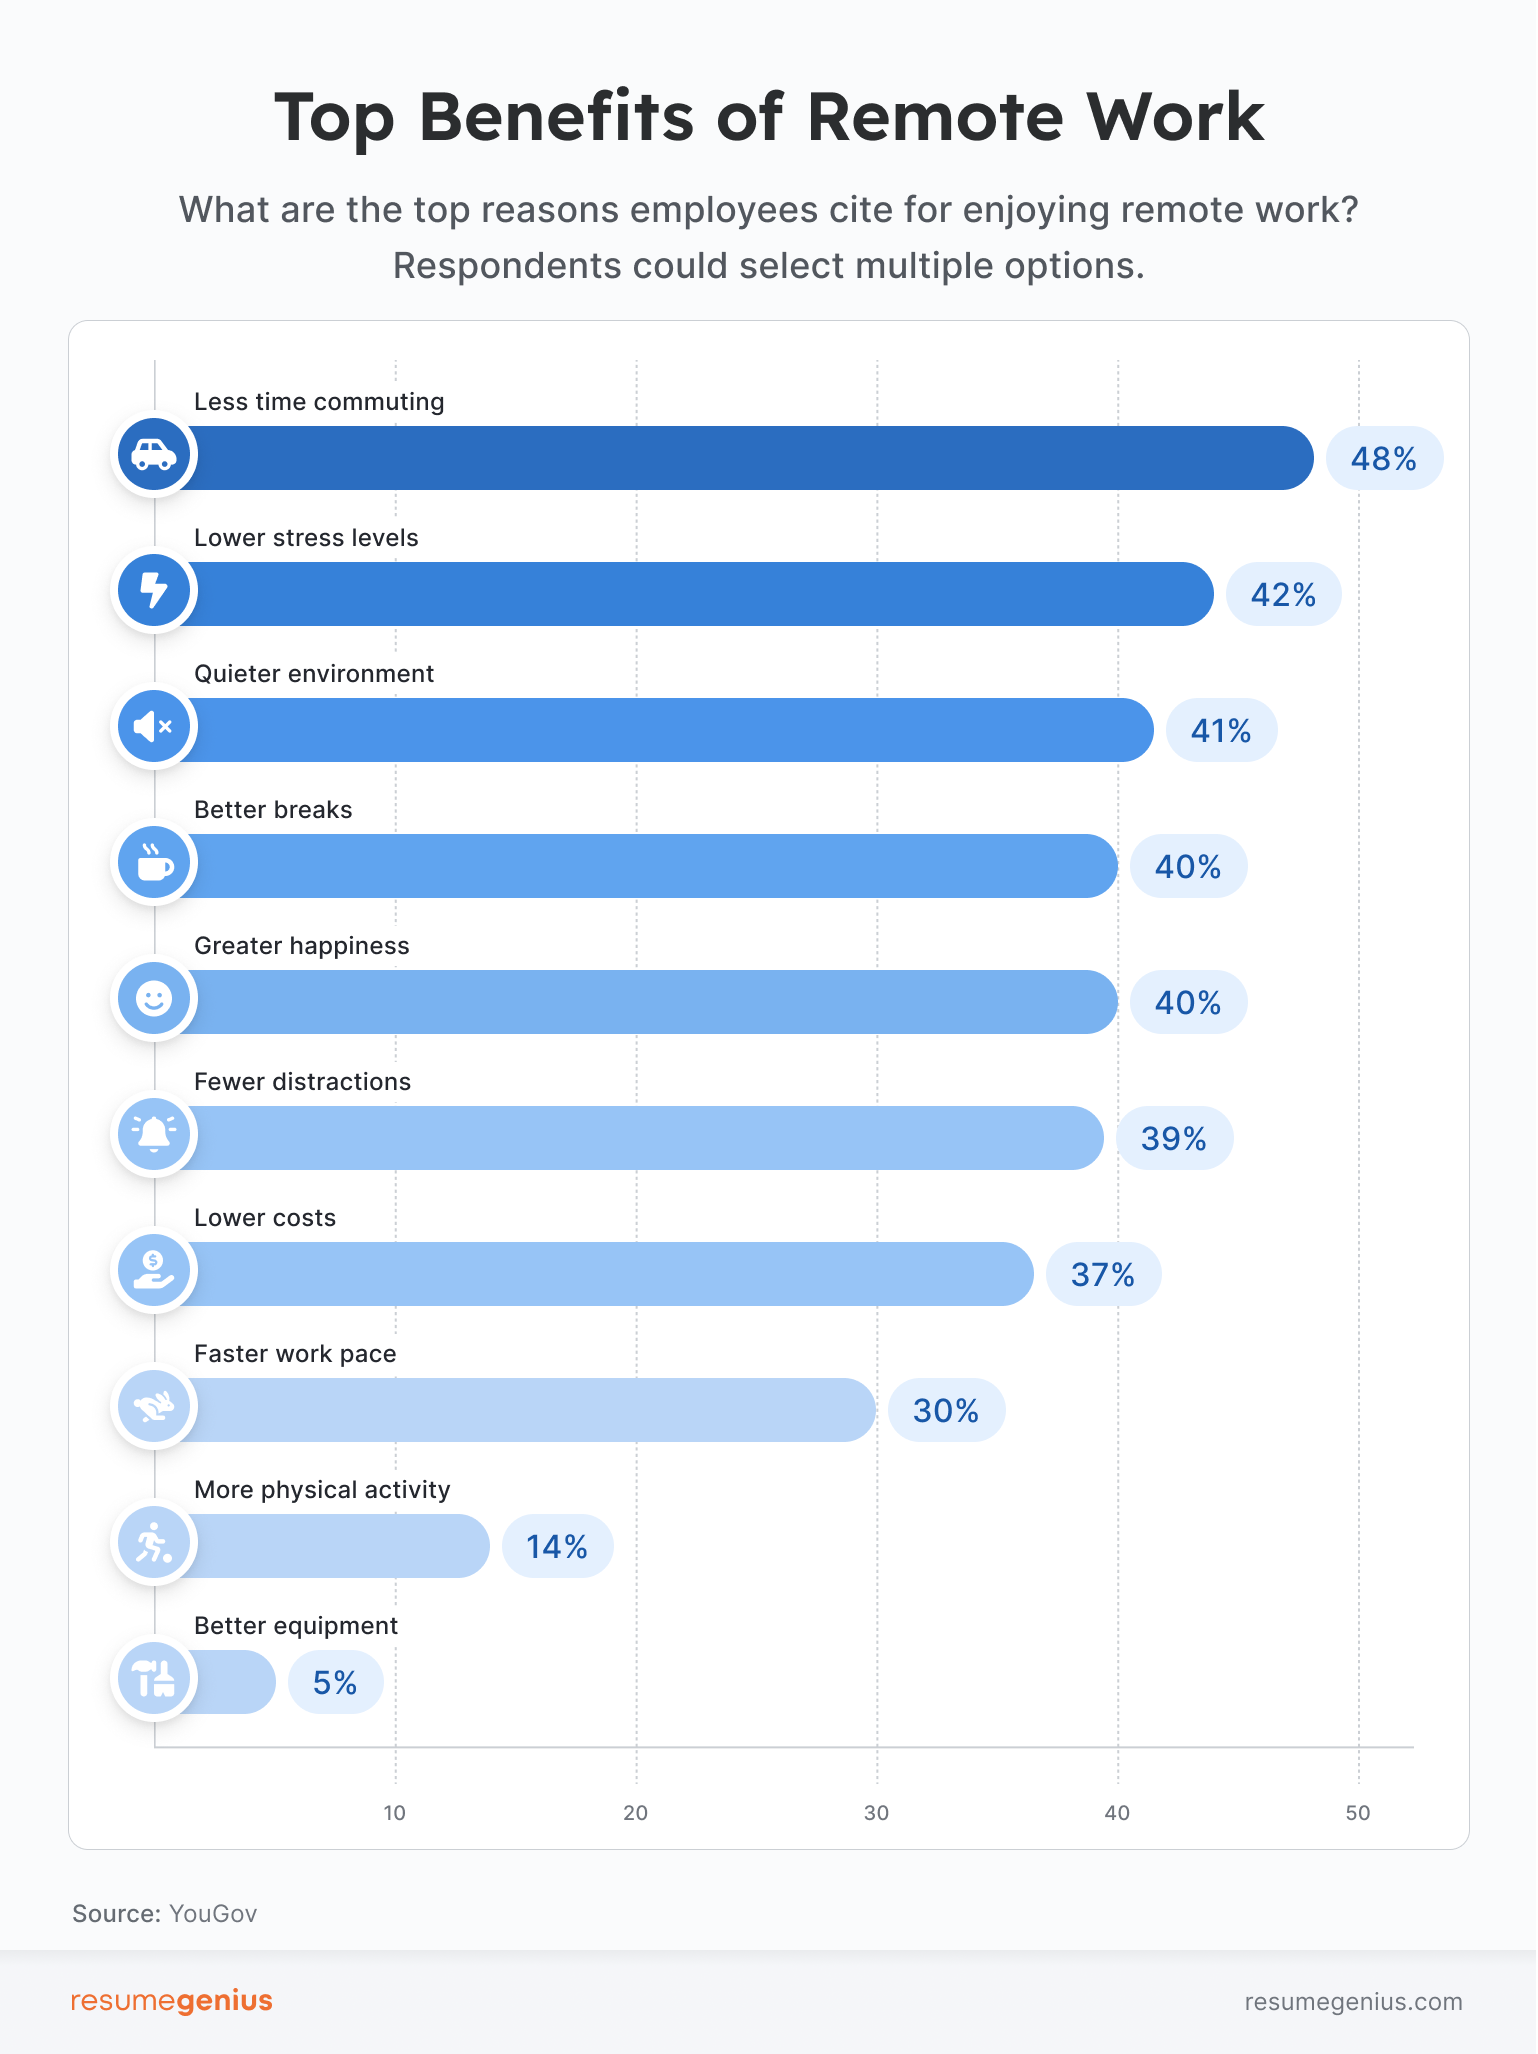
- Among remote workers, the most valued perks are:
- Less time spent commuting (48%)
- Lower stress levels (42%)
- A quieter work environment (41%)
- More time for other activities during breaks (40%) (YouGov, 2025)
Flexibility and vacation guilt
Flexibility is now a defining factor in work–life balance, but the data shows a clear divide. While employees are happy with when they can work, far fewer are satisfied with where they can work. And although there’s been progress toward flexible arrangements, burnout remains a persistent issue.
- Nearly half of workers (46%) say they’d look for a new job if their employer no longer allowed them to work from home (Pew Research Center, 2024)
- 49% of workers are highly satisfied with their flexibility to choose when they work (Pew Research Center, 2024)
- In contrast, only 37% of workers are highly satisfied with their flexibility to work remotely (Pew Research Center, 2024)
- Despite ongoing wellness initiatives, burnout affects 67% of the workforce (Moodle, 2025)
Employee benefit statistics: misaligned priorities between management and staff
Employers and employees often have different ideas about which benefits matter most. This section breaks down sentiment from employees and employers toward various benefits.
Worker demand
The gap between employer offerings and employee needs is widening. While employers continue to focus on traditional benefits like health and retirement, employees under high financial stress are increasingly demanding financial wellness support.
- Employers rank health-related benefits (88%), retirement plans (81%), and leave-related benefits (81%) as the most crucial categories to offer (SHRM, 2025)
- 77% of employees report feeling stressed about the current economic climate, fueling a rising demand for financial wellness benefits, such as debt assistance, retirement contributions, and financial education (Bank of America, 2025)
- Access to retirement plans still depends heavily on company size: only 59% of workers in establishments with fewer than 100 workers have access, compared to 90% of workers in establishments with 500 workers or more (Bureau of Labor Statistics, 2025)
Costs and contributions
Core benefits like healthcare and retirement are coming under increasing financial strain. Employees face a double burden: skyrocketing healthcare premiums that cut deeply — to the tune of nearly $7,000 per worker — into take-home pay, and no access to long-term retirement plans for 30% of private-sector workers.
- The average annual premium for employer-sponsored family health coverage reached almost $27,000 in 2025, up 6% from the previous year (KFF, 2025)
- Workers now contribute an average of $6,850 annually toward their family coverage premiums (KFF, 2025)
- A retirement access gap persists: only 72% of private-sector workers have access to retirement benefits, compared to 99% of state and local government employees (Bureau of Labor Statistics, 2025)
Management impact statistics: a good boss is crucial
Managers remain one of the most polarizing forces in the modern workplace, and the data shows just how much influence they have on their subordinates, and how employees feel about this relationship.
Manager–employee disconnect
While the relationship between employees and their managers is the single biggest factor in job satisfaction, a growing “satisfaction gap” between managers and their teams is driving turnover, especially among Gen Z workers.
- An employee’s relationship with their direct manager is the most important factor in determining overall job satisfaction (McKinsey, 2025)
- However, a significant “satisfaction gap” exists: 47% of managers “love their job,” compared to only 31% of individual contributors (YouGov, 2025)
- This disconnect is most pronounced among Gen Z workers, 62% of whom say they feel they face high performance expectations but lack sufficient support (Resume Genius, 2025)
- 26% of employees who left their jobs cited a poor relationship with their manager as a major reason for leaving (McKinsey, 2025)
- When asked what makes a great manager, employees cited:
- Trusting employees to work independently (43%)
- Being knowledgeable about their role (38%)
- Promoting work–life balance (34%)
- Providing constructive feedback (32%) (Resume Genius, 2024)
Costs of disengagement
Low employee engagement, often rooted in disengaged leadership, carries a staggering cost for both organizations and the global economy.
- Managers account for 70% of the variance in team engagement, yet only 27% of managers report being engaged at work themselves (Gallup, 2024)
- This leadership gap has contributed to a 10-year low in U.S. employee engagement, which now stands at just 31% (Gallup, 2024)
- The productivity drop from disengaged employees cost the global economy $428 billion in 2024 (Gallup, 2024)
Demographic trends
Job satisfaction is far from universal. The data reveals deep divides across geography, industry, gender, and generation. While regional and industry differences create clear winners and losers, two findings stand out: a widening “satisfaction gap” between Gen Z and Boomers, and a gender paradox: women report higher overall satisfaction than men, yet still face a persistent pay gap and higher levels of burnout.
Location statistics
Where you work plays a major role in how happy you are:
- The Western U.S. leads the nation in job quality, with 44% of workers in “quality jobs,” , compared to the Northeast (39%), South (38%), and Midwest (36%) (Gallop, 2025)
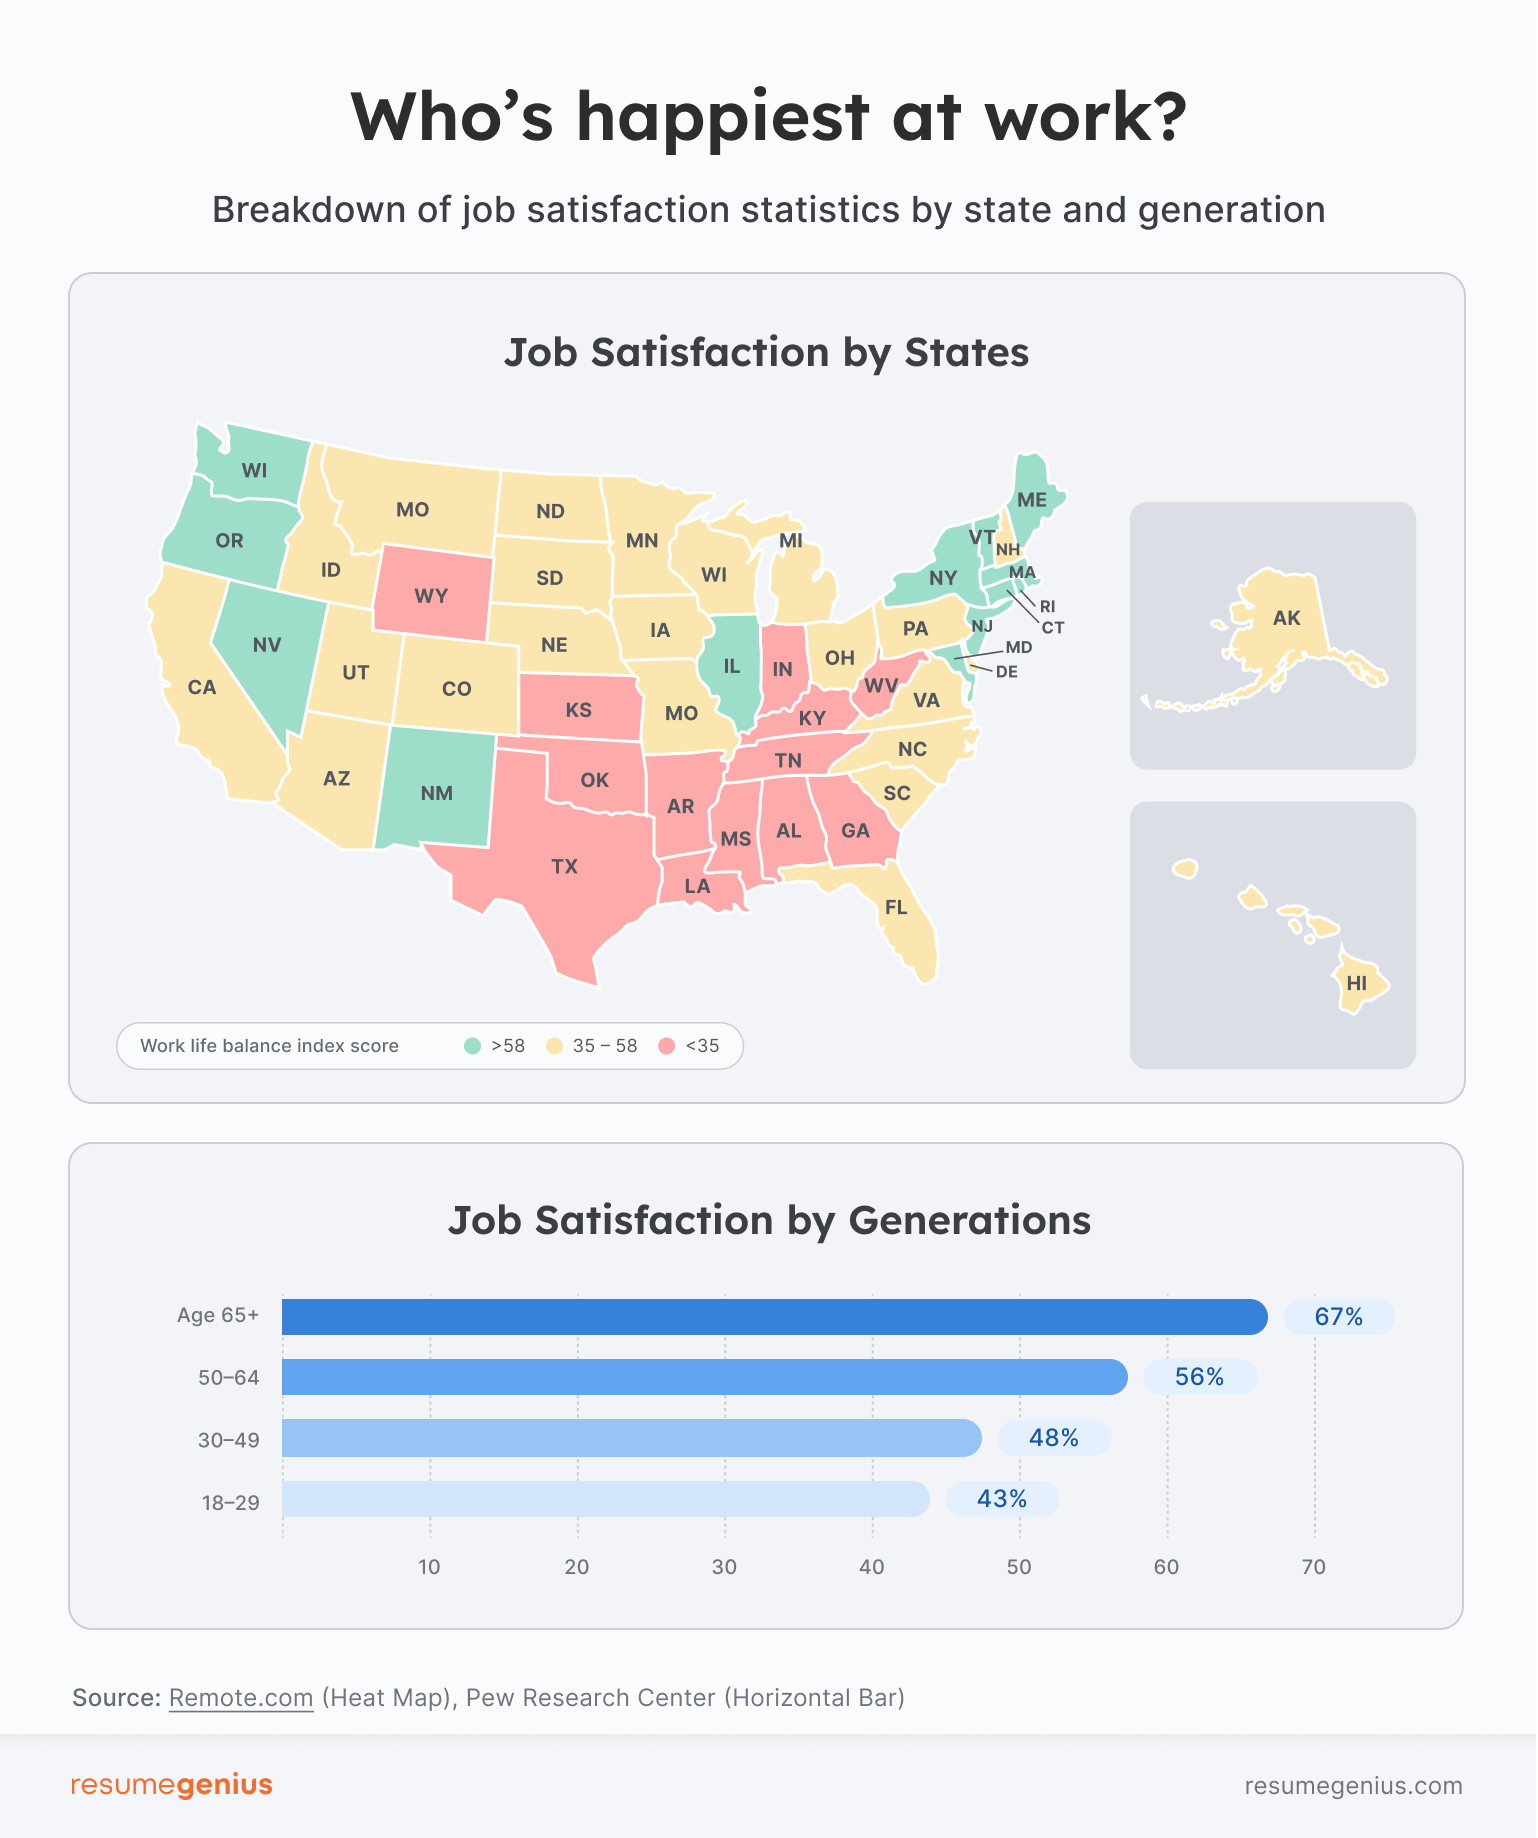
- Maine, Washington, and Illinois rank as the best states for work–life balance , while Alabama, Mississippi, and Louisiana rank the worst (Remote.com, 2025)
- According to Oxfam’s “Best States to Work” index, which measures worker-friendly policies, the District of Columbia, California, and Oregon lead the nation, while North Carolina, Mississippi, and Alabama sit at the bottom (Oxfam, 2025)
- Worker sentiment also varies sharply by city: at least half of employees in Salt Lake City, Miami, and Dallas–Fort Worth say they love their jobs, while Austin, Charlotte, and St. Louis have the highest concentrations of workers who say they hate their jobs (YouGov, 2025)
Industry-specific statistics
Job satisfaction also varies dramatically across industries:
- Professional Services (53%), Finance (48%), and Wholesale Trade (49%) have the highest concentration of “quality jobs” (Gallup, 2025)
- Leisure and Hospitality (29%) and Retail and Warehousing (26%) report the lowest concentration of “quality jobs” (Gallup, 2025)
- The Construction industry has held the top spot for employee satisfaction for 22 consecutive months, maintaining a 12-point lead over the sector in second place (BambooHR, 2025)
- The Education sector was the only industry to experience a decline in employee satisfaction during the first quarter of 2025 (BambooHR, 2025)
- Workers in Agriculture, Forestry, Fishing, and Hunting report the highest job enjoyment, with 89% saying they either “love” or “like” their jobs (YouGov, 2025)
Gender statistics
According to a 2025 Conference Board report, women’s overall job satisfaction (68.8%) surpassed that of men’s (67.9%) for the first time since 2011. Despite that shift, women continue to trail men in most compensation-related categories:
- Women lag behind in 21 out of 27 metrics, especially those tied to pay, bonuses, and retirement (The Conference Board, 2025)
- Only 33% of women feel their current salary meets their lifestyle needs, compared to 50% of men (BambooHR, 2025)
- Women received smaller average pay raises than men last year (2.7% vs. 4.8%) (BambooHR, 2025)
- Women are more likely than men to feel stressed about their typical workday (47% vs. 41%) and about personal and family life (45% vs. 32%) (Bank of America, 2025)
- Women are considerably more likely than men to feel tempted to leave their company due to burnout (39% vs. 30%) (Bank of America, 2025)
Generation statistics
The generational divide in job satisfaction widened in 2025, with younger workers reporting lower happiness levels than their older peers:
- The job satisfaction gap between workers over 55 and those under 25 has expanded to 15 points (The Conference Board, 2025)
- Workers under 25 are the only age group to experience a decline in job satisfaction over the past year — 72.4% of workers aged 55 and older report being satisfied with their jobs, compared to just 57.4% of their colleagues under 25 (The Conference Board, 2025)
- 67% of workers aged 65 and older are “extremely or very satisfied,” versus only 43% of workers under 30 (Pew Research Center, 2025)
- Gen Z (40%) and Millennial (35%) employees are the most likely to be actively planning a job change (Robert Half, 2025)
- For Gen Z, work–life balance (74%) far outweighs pay (68%) as the top career priority. For Baby Boomers, the reverse remains true: pay (87%) still ranks above work–life balance (85%) (Randstad, 2025)
Outlook statistics: the future of work and employee loyalty
The future of work and employee loyalty present a dual challenge: fixing today’s problems while preparing for tomorrow’s evolving skill demands. The data shows that toxic cultures — not pay — are the biggest driver of employee turnover, while AI isn’t replacing jobs but creating a massive “skills premium,” leading to new, non-negotiable demand from workers for upskilling opportunities.
Employee loyalty statistics
- A toxic company culture is 10 times more likely to predict employee attrition than dissatisfaction with pay (APA, 2024)
- 15% of workers describe their workplace as “somewhat or very toxic” (APA, 2024)
- 44% of workers have quit a job specifically because of a toxic culture (Randstad, 2025)
- For employees who remain with a company, the top reasons are job security (39%), a healthy work–life balance (34%), and positive relationships with colleagues (33%) (McKinsey, 2025)
Future skills statistics
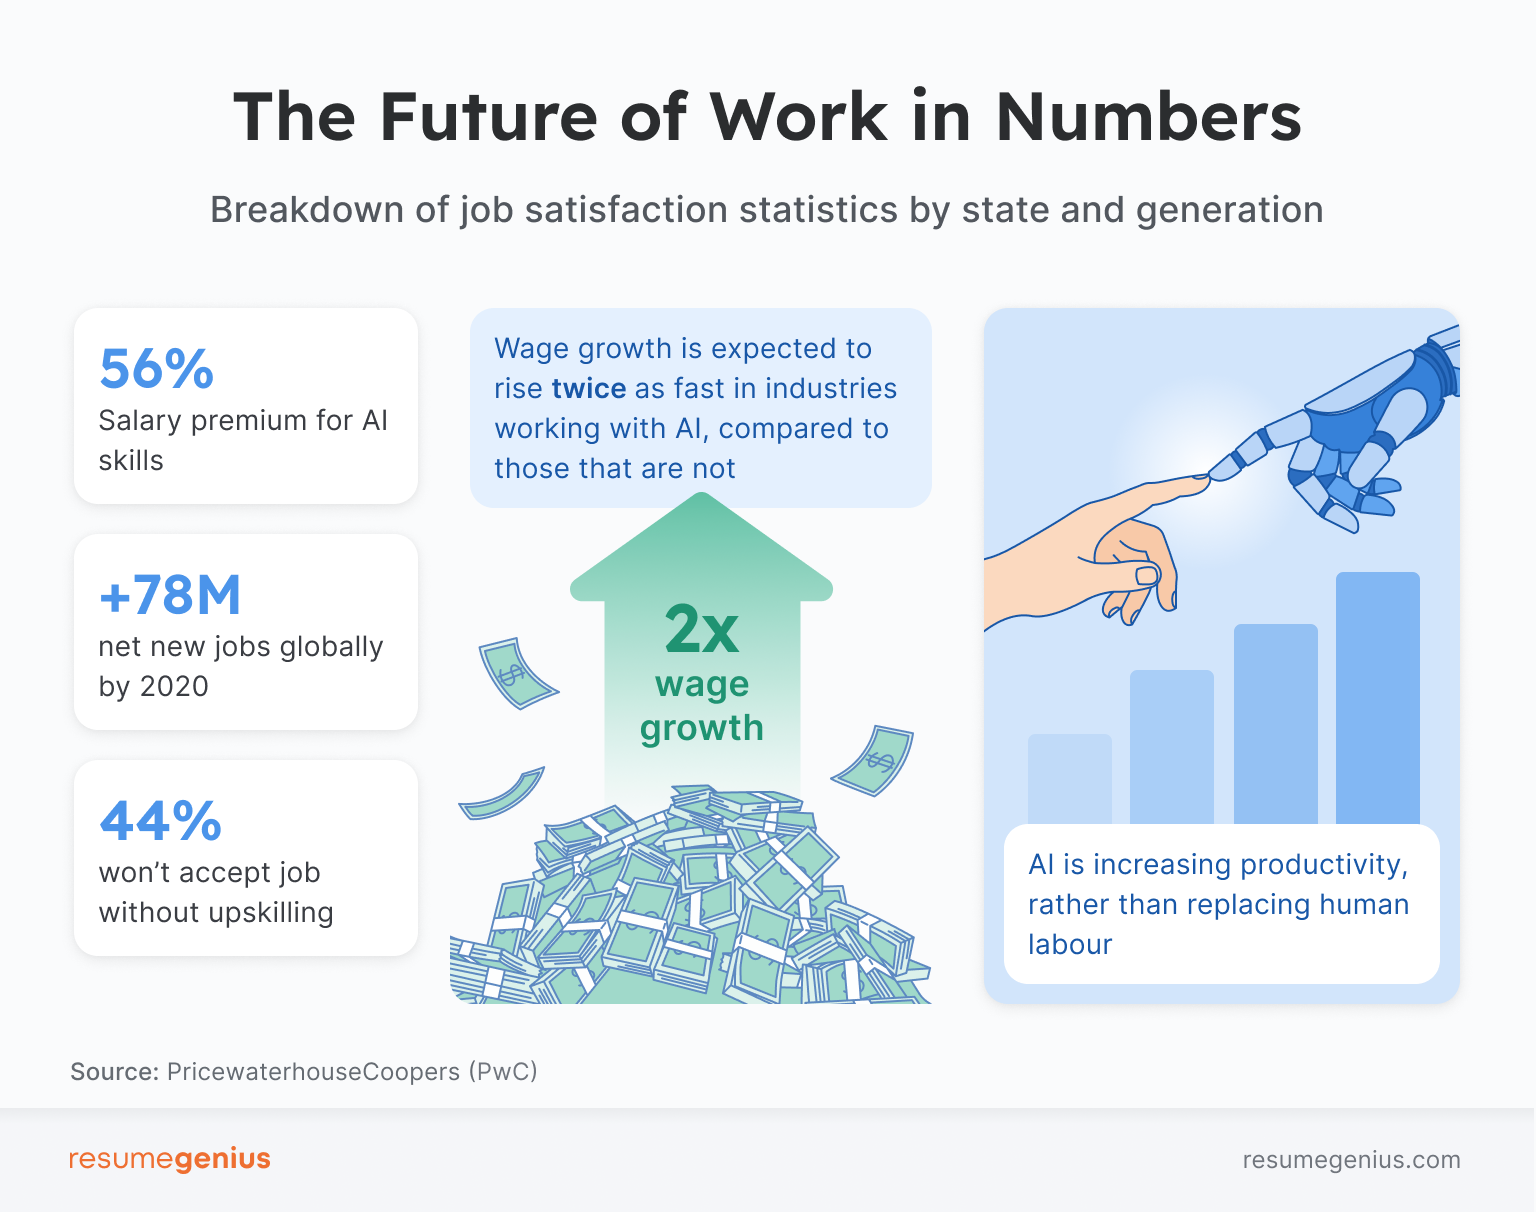
- The World Economic Forum projects a net global job growth of 78 million by 2030, with 170 million new jobs created and 92 million displaced (World Economic Forum, 2025)
- The skills employers seek are changing 66% faster in occupations highly exposed to AI compared to those that are not (PWC, 2025)
- Employees with AI-related skills now earn an average salary premium of 56%, up from 25% last year (PWC, 2025)
- Wages are rising twice as fast in industries most exposed to AI, suggesting the technology is augmenting, not replacing, human capabilities (PWC, 2025)
- 44% of workers say they wouldn’t accept a job that didn’t offer upskilling or reskilling opportunities (Randstad, 2025)
Surprising statistics about job satisfaction
Even in a year of rising job satisfaction, some of the data defies expectations:
- 40% of managers report a decline in their own mental health after being promoted into leadership roles (Deloitte, 2025)
- 63% of workers admit to hiding aspects of their identity or personality at work, up sharply from 55% the previous year (Randstad, 2025)
- 45% of Americans who exercise daily say they love their job, compared to just 28% of Americans who say they don’t exercise at least once a month (YouGov, 2025)
- Gallup estimates that raising global employee engagement to best-practice levels (around 70%) could unlock an additional $9.6 trillion in the world economy (Gallup, 2025)
- 63% of LGBTQ+ Americans say they love or like their job, compared to 74% of all U.S. workers (YouGov, 2025)
- Industries most able to use AI have 3× higher revenue growth per employee (PWC, 2025)
- Only 3% of Americans say they outright hate their job (YouGov, 2025)
Conclusion
Overall job satisfaction reached record highs in 2025, yet most workers still struggle with low pay, burnout, and ineffective management. As the data shows, a healthy work–life balance and a supportive culture have become key to happiness at work.
For the first time in 22 years, work–life balance has overtaken pay as the top global priority, signaling a lasting shift in how people define a “good job.”
However, deep divides remain: women continue to feel stressed and underpaid, while Gen Z workers are the least satisfied overall. Together, these findings suggest that genuine happiness at work depends less on salary and more on flexibility, fair leadership, and a culture that prioritizes well-being and growth.
Frequently asked questions about job satisfaction
1. What is the current level of job satisfaction in 2025?
Around 81% of employees say they’re at least somewhat satisfied with their jobs, though only half report being highly satisfied. This finding marks a major improvement in overall job satisfaction compared to previous years, despite declining satisfaction in key areas like pay, benefits, and management feedback.
2. What factors influence job satisfaction the most in 2025?
For the first time in more than two decades, work–life balance has overtaken pay as the biggest motivator. Other key drivers include job security, positive relationships with managers, a sense of alignment with company values, and growth opportunities, with priorities varying substantially by generation.
3. Which groups are least satisfied with their jobs?
Gen Z employees and men report the lowest levels of job satisfaction. Younger workers cite burnout and a lack of support as key contributors to their low job satisfaction levels. Although women experience higher stress and heavier workloads, they report slightly higher overall satisfaction, suggesting they’re finding meaning or balance in other aspects of work.
4. How is AI affecting job satisfaction?
AI is reshaping the workplace faster than ever, and employees who develop AI-related skills now earn up to 56% more on average. Rather than replacing workers, AI is rewarding adaptability and continuous learning.
5. What are the most satisfying jobs?
According to BambooHR, the construction industry has held the highest level of employee satisfaction for 22 consecutive months. Meanwhile, YouGov reports that workers in Agriculture, Forestry, Fishing, and Hunting express the greatest enjoyment, with 89% stating they “love” or “like” their jobs. The data suggests that a genuine passion for your work results in the highest levels of lasting job satisfaction.
Sources
- American Psychological Association, Work in America Survey 2024
- BambooHR, Employee Satisfaction Report
- BambooHR, The Great Pay Divide
- Bank of America, Workplace Benefits Report 2025
- Bureau of Labor Statistics, Consumer Price Index, September 2025
- Deloitte, 2025 Global Human Capital Trends
- Deloitte, Gen Z and Millennials at Work
- Gallup, American Job Quality Study
- Gallup, State of the Global Workplace
- KFF, 2025 Employer Health Benefits Survey
- McKinsey, HR Monitor 2025
- McKinsey, The Boss Factor
- Moodle, State of Work Report
- Oxfam, Best States to Work Index
- Pew Research Center, Americans’ Job Satisfaction in 2024
- PWC, 2025 Global AI Jobs Barometer
- Randstad, workmonitor
- Remote.com, US Life-Work Balance Index
- Resume Genius, 2025 Gen Z Work Mindset Report
- Resume Genius, 2024 Job Seeker Insights Survey
- Robert Half, Career Satisfaction on the Rise
- SHRM, Employee Benefits Survey
- The Conference Board, Job Satisfaction 2025
- Work Institute, Retention Report
- World Economic Forum, The Future of Work Report 2025
- YouGov, Job Satisfaction Report 2025
About Resume Genius
Since 2009, Resume Genius and its resume builder software have been helping people from all backgrounds and experience levels land their next jobs faster.
Resume Genius also provides a wide range of free career resources, including customizable resume templates, resume examples for different industries, and resume writing guides, to help job seekers find fulfilling work and reach their career goals.
Resume Genius is led by a team of dedicated career advisors and HR experts and has been featured in The New York Times, Harvard Business Review, Fast Company, CNBC, and USA Today.
For media inquiries, please contact us.
About the Author

Jack Hulatt graduated from the University of Greenwich with a bachelor’s degree in Politics and International Relations before pursuing certifications in computer science and data analytics. In his short career, he has already worked on multiple entrepreneurial projects and as part of a larger team, giving him direct insight into the needs and wants of young job seekers today.